Free Access
Fig. 9
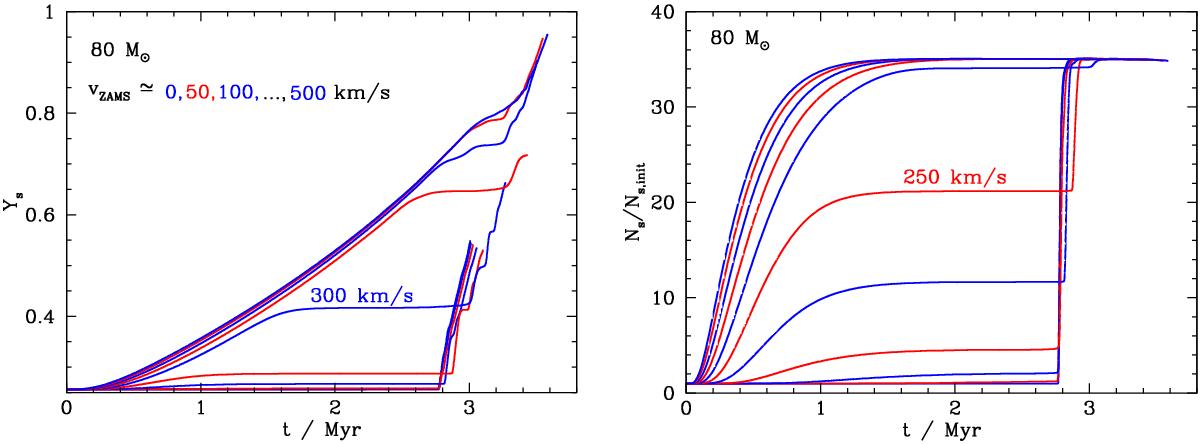
Helium (left panel) and nitrogen (right panel) surface mass fraction as a function of time for models of 80 M⊙ with approximate initial rotational velocities of 0, 50, 100, 150, 200, 250, 300, 350, 400, 450, and 500 km s-1, during their core hydrogen burning evolution.
This figure is made of several images, please see below:
Current usage metrics show cumulative count of Article Views (full-text article views including HTML views, PDF and ePub downloads, according to the available data) and Abstracts Views on Vision4Press platform.
Data correspond to usage on the plateform after 2015. The current usage metrics is available 48-96 hours after online publication and is updated daily on week days.
Initial download of the metrics may take a while.