Fig. 7
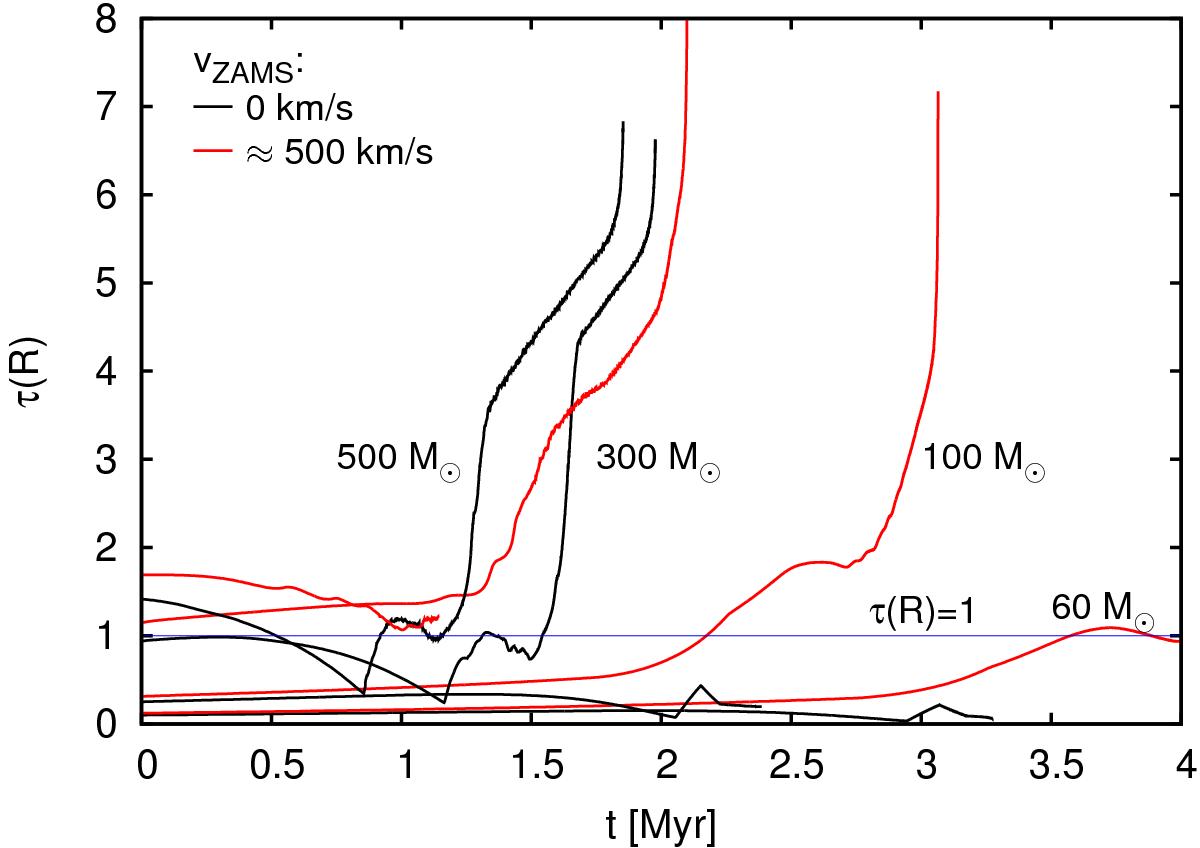
Stellar wind optical depth according to Eq. (1), for some of our model sequences, shown as a function of time. We show eight stellar models with four different initial masses (60, 100, 300, 500 M⊙), and two initial surface rotational velocities (0, 500 km s-1) in black and red, respectively. The line for unit wind optical depth is plotted to facilitate the comparison.
Current usage metrics show cumulative count of Article Views (full-text article views including HTML views, PDF and ePub downloads, according to the available data) and Abstracts Views on Vision4Press platform.
Data correspond to usage on the plateform after 2015. The current usage metrics is available 48-96 hours after online publication and is updated daily on week days.
Initial download of the metrics may take a while.