Fig. 20
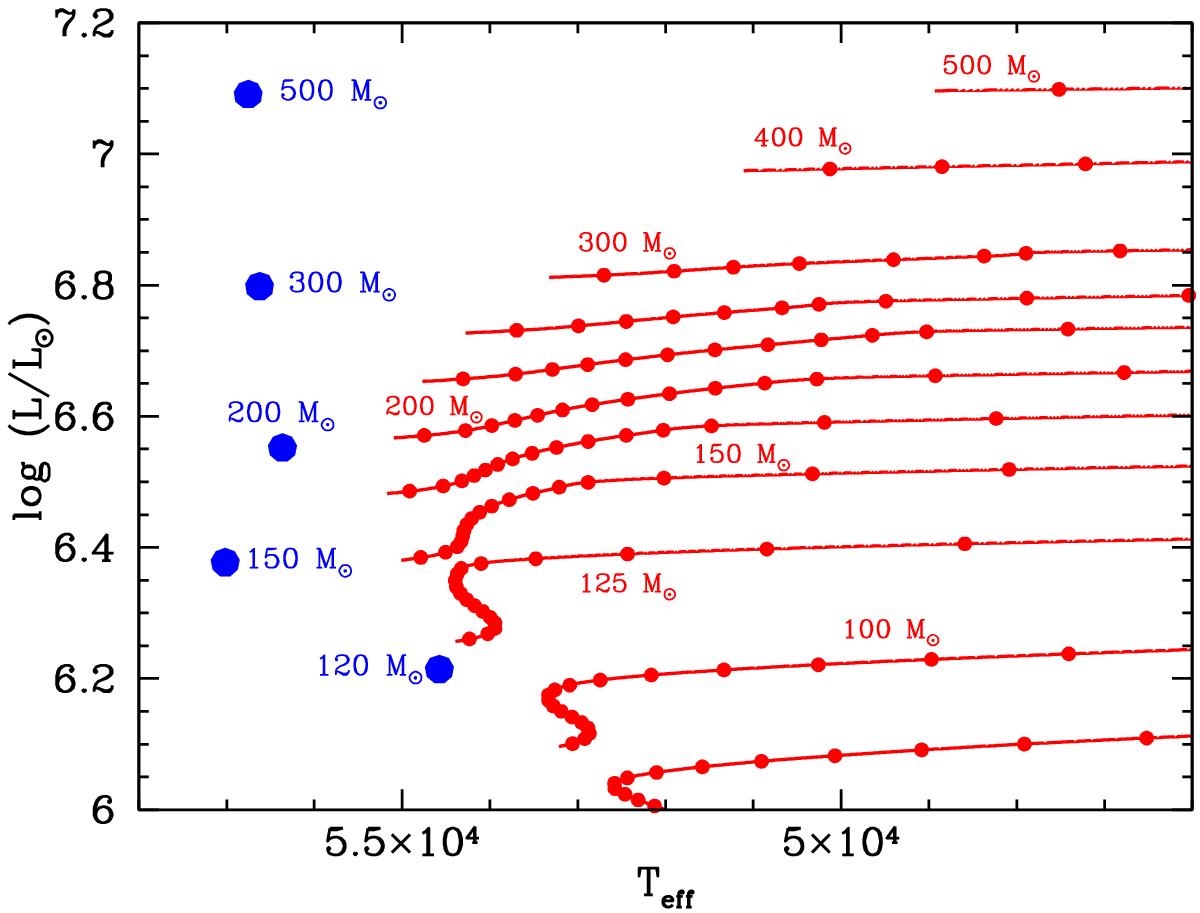
Comparison of the ZAMS position of the models from Yusof et al. (2013) which include rotation (blue dots) with our tracks for νrot,i ≃ 300 km s-1 (red lines) in the HR diagram. We show tracks with initial masses of 80 M⊙, 100 M⊙, 125 M⊙, 150 M⊙, 175 M⊙, 200 M⊙, 230 M⊙, 260 M⊙, 300 M⊙, 400 M⊙, and 500 M⊙. The time interval between two dots on the tracks corresponds to 105 yr.
Current usage metrics show cumulative count of Article Views (full-text article views including HTML views, PDF and ePub downloads, according to the available data) and Abstracts Views on Vision4Press platform.
Data correspond to usage on the plateform after 2015. The current usage metrics is available 48-96 hours after online publication and is updated daily on week days.
Initial download of the metrics may take a while.