Fig. 2
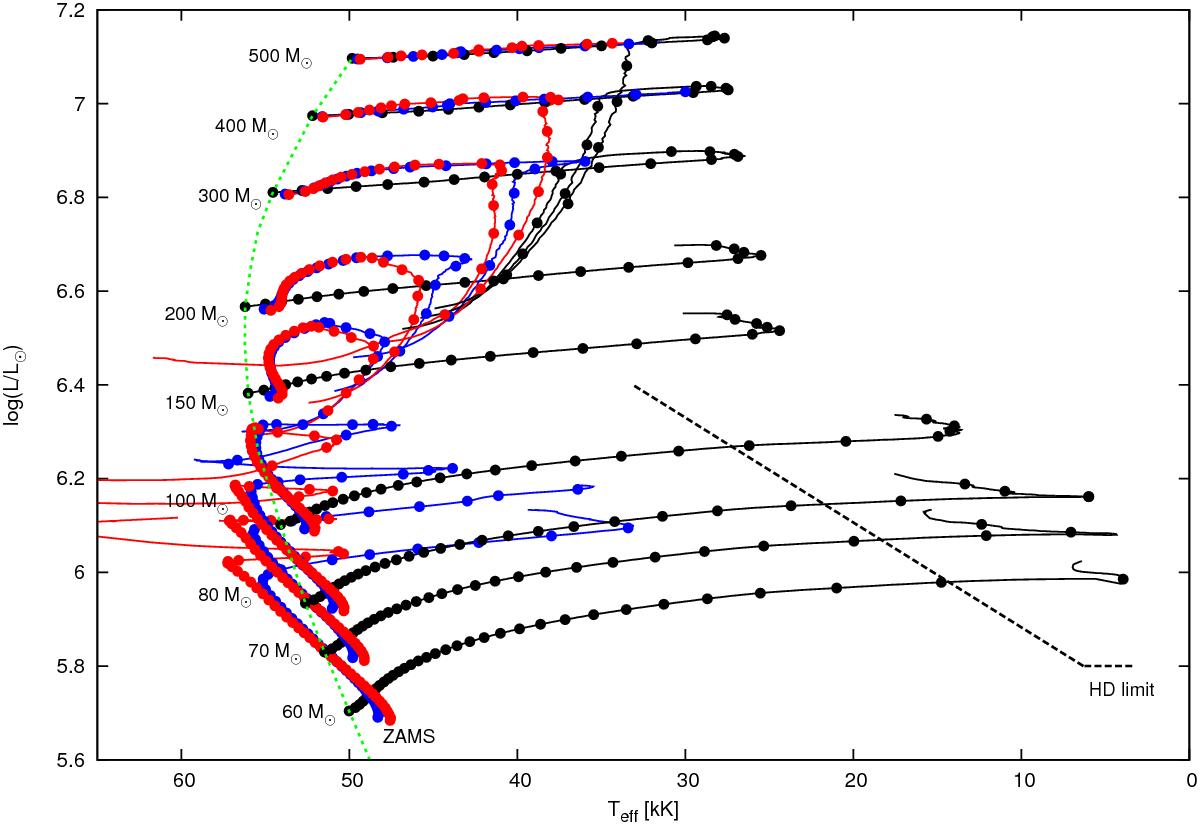
Evolutionary tracks of massive stars during their core hydrogen burning evolution in the Hertzsprung-Russell diagram. For each selected initial mass (as labelled), tracks are shown for three different initial surface rotational velocities, νZAMS = 0,400,500 km s-1, in black, blue, and red, respectively. The time difference between two successive dots on each track is 105 yr. The ZAMS is drawn as a green dashed line. The end of the tracks corresponds to the terminal age main sequence. The approximate location of the Humphreys-Davidson limit is indicated by the black dashed line (Humphreys & Davidson 1994).
Current usage metrics show cumulative count of Article Views (full-text article views including HTML views, PDF and ePub downloads, according to the available data) and Abstracts Views on Vision4Press platform.
Data correspond to usage on the plateform after 2015. The current usage metrics is available 48-96 hours after online publication and is updated daily on week days.
Initial download of the metrics may take a while.