Fig. 18
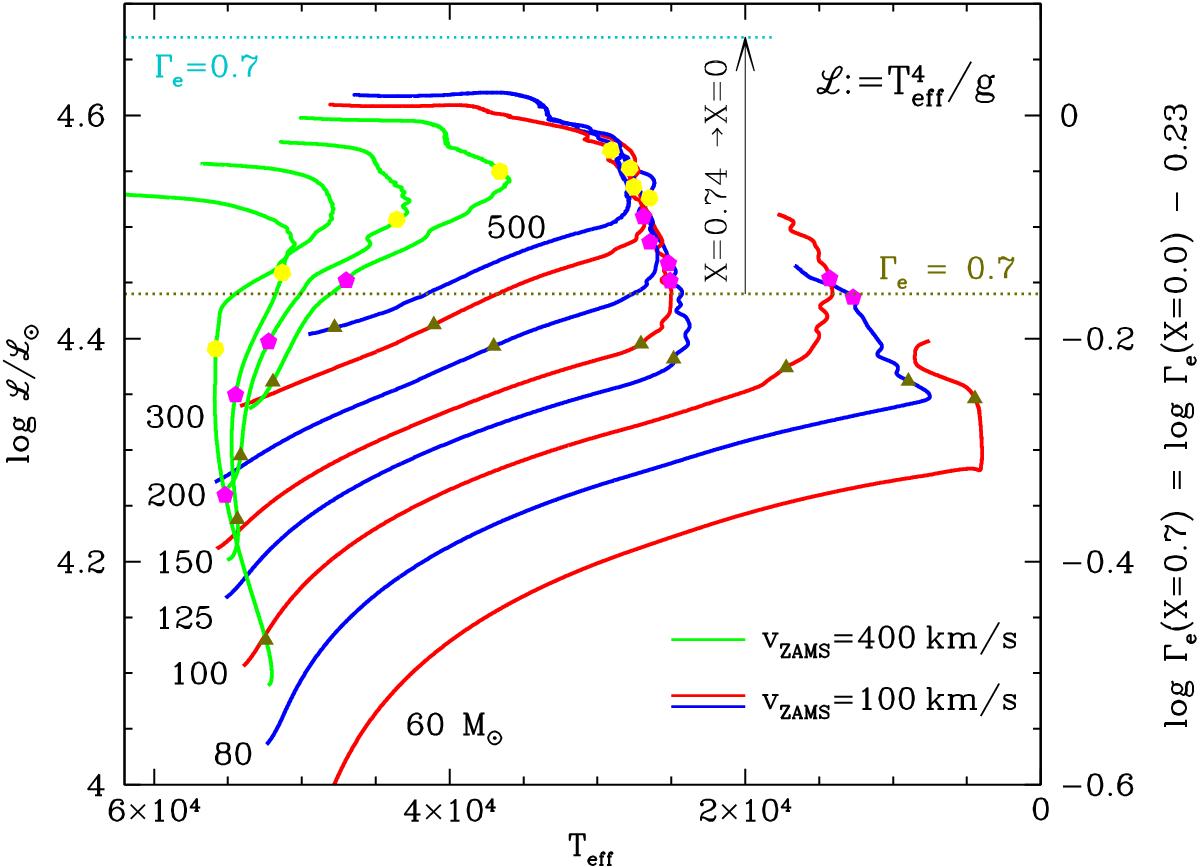
Evolutionary tracks in the L – Teff-diagram, where ![]() , for models initially rotating with 100 km s-1 (for 60, 80, 100, 125, 150, 200, 300, and 500 M⊙; alternating red and blue lines) and with 400 km s-1 (100, 150, 200, and 300 M⊙; green lines). The right y-axis shows the Eddington factor for electron scattering opacity Γe, which is proportional to L, for a hydrogen mass fraction of X = 0.74. For X = 0, log Γe is larger by 0.23. Triangles, pentagons, and heptagons mark the locations where the surface helium mass fraction reaches 0.3, 0.5, and 0.7, respectively, for the presented evolutionary sequences. The dotted horizontal lines marks the value of Γe = 0.7 for X = 0.74 (green) and X = 0 (blue), approximately identifying the true Eddington limit that cannot be exceeded (see text).
, for models initially rotating with 100 km s-1 (for 60, 80, 100, 125, 150, 200, 300, and 500 M⊙; alternating red and blue lines) and with 400 km s-1 (100, 150, 200, and 300 M⊙; green lines). The right y-axis shows the Eddington factor for electron scattering opacity Γe, which is proportional to L, for a hydrogen mass fraction of X = 0.74. For X = 0, log Γe is larger by 0.23. Triangles, pentagons, and heptagons mark the locations where the surface helium mass fraction reaches 0.3, 0.5, and 0.7, respectively, for the presented evolutionary sequences. The dotted horizontal lines marks the value of Γe = 0.7 for X = 0.74 (green) and X = 0 (blue), approximately identifying the true Eddington limit that cannot be exceeded (see text).
Current usage metrics show cumulative count of Article Views (full-text article views including HTML views, PDF and ePub downloads, according to the available data) and Abstracts Views on Vision4Press platform.
Data correspond to usage on the plateform after 2015. The current usage metrics is available 48-96 hours after online publication and is updated daily on week days.
Initial download of the metrics may take a while.