Fig. 12
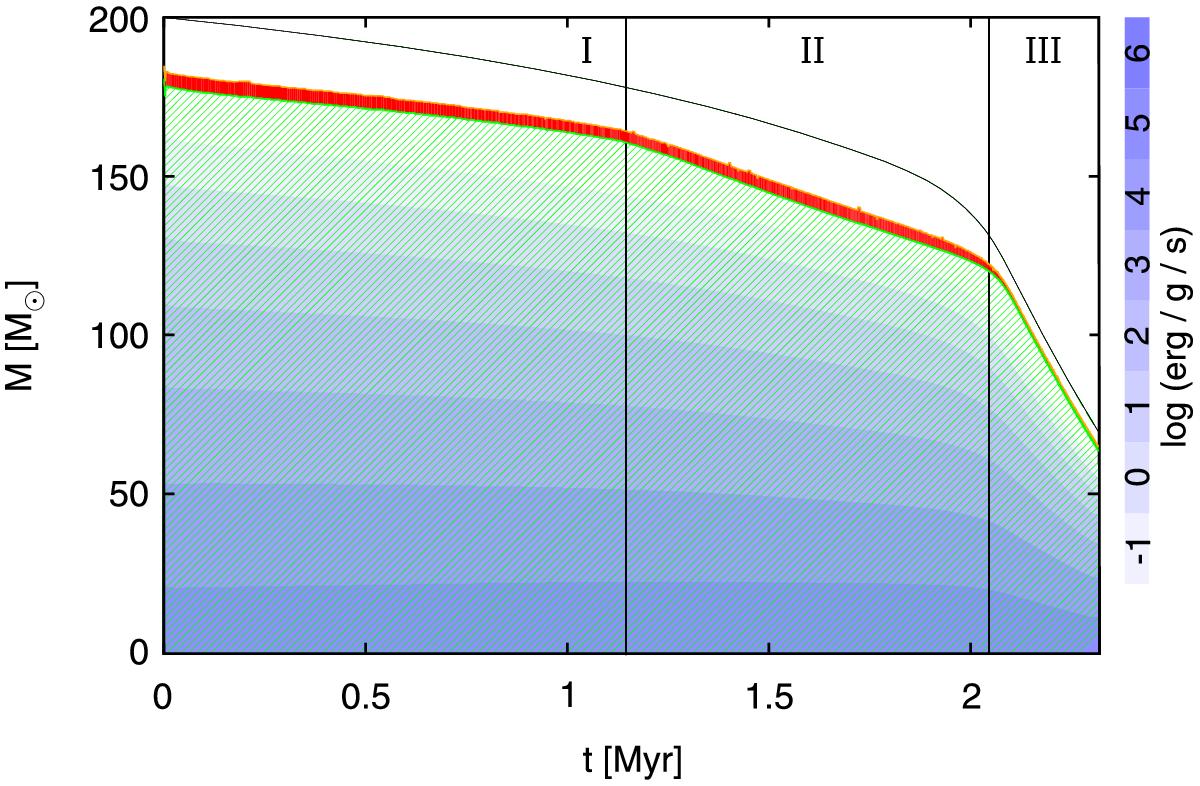
Kippenhahn-diagram for our 200 M⊙ model with vZAMS ≃ 300 km s-1. The black solid line gives the stellar mass as a function of time. Blue shading indicates thermonuclear energy generation (see colour bar to the right of the plot). Green hatched parts show convective regions, and convective core overshooting is indicated in red. Three different regimes can be distinguished according to the rate at which the mass of the convective core decreases (see text).
Current usage metrics show cumulative count of Article Views (full-text article views including HTML views, PDF and ePub downloads, according to the available data) and Abstracts Views on Vision4Press platform.
Data correspond to usage on the plateform after 2015. The current usage metrics is available 48-96 hours after online publication and is updated daily on week days.
Initial download of the metrics may take a while.