Fig. 1
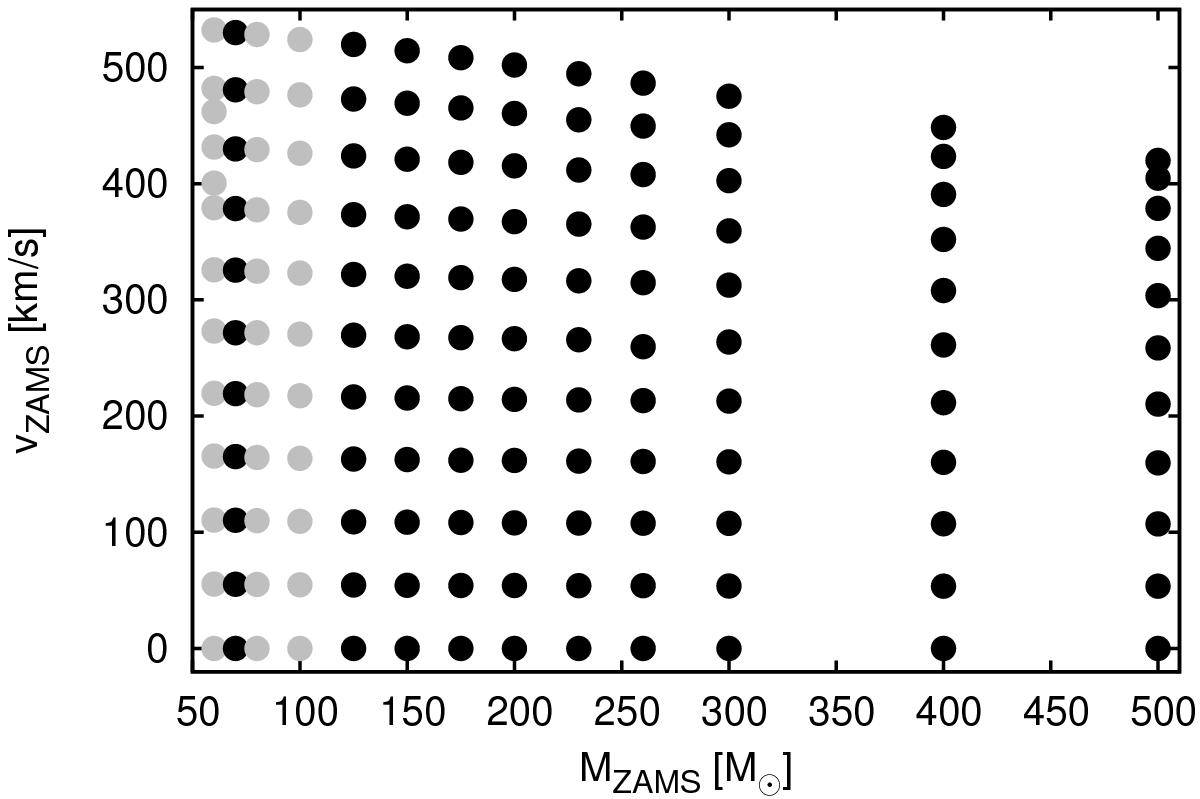
Initial equatorial rotational velocity versus initial mass. Each dot in this diagram represents the evolutionary sequence in our model grid with the corresponding initial parameters. Grey dots correspond to models presented in Brott et al. (2011a) as well as previously unpublished models calculated by I. Brott, while black dots represent the 110 newly computed evolutionary sequences.
Current usage metrics show cumulative count of Article Views (full-text article views including HTML views, PDF and ePub downloads, according to the available data) and Abstracts Views on Vision4Press platform.
Data correspond to usage on the plateform after 2015. The current usage metrics is available 48-96 hours after online publication and is updated daily on week days.
Initial download of the metrics may take a while.