Fig. 9
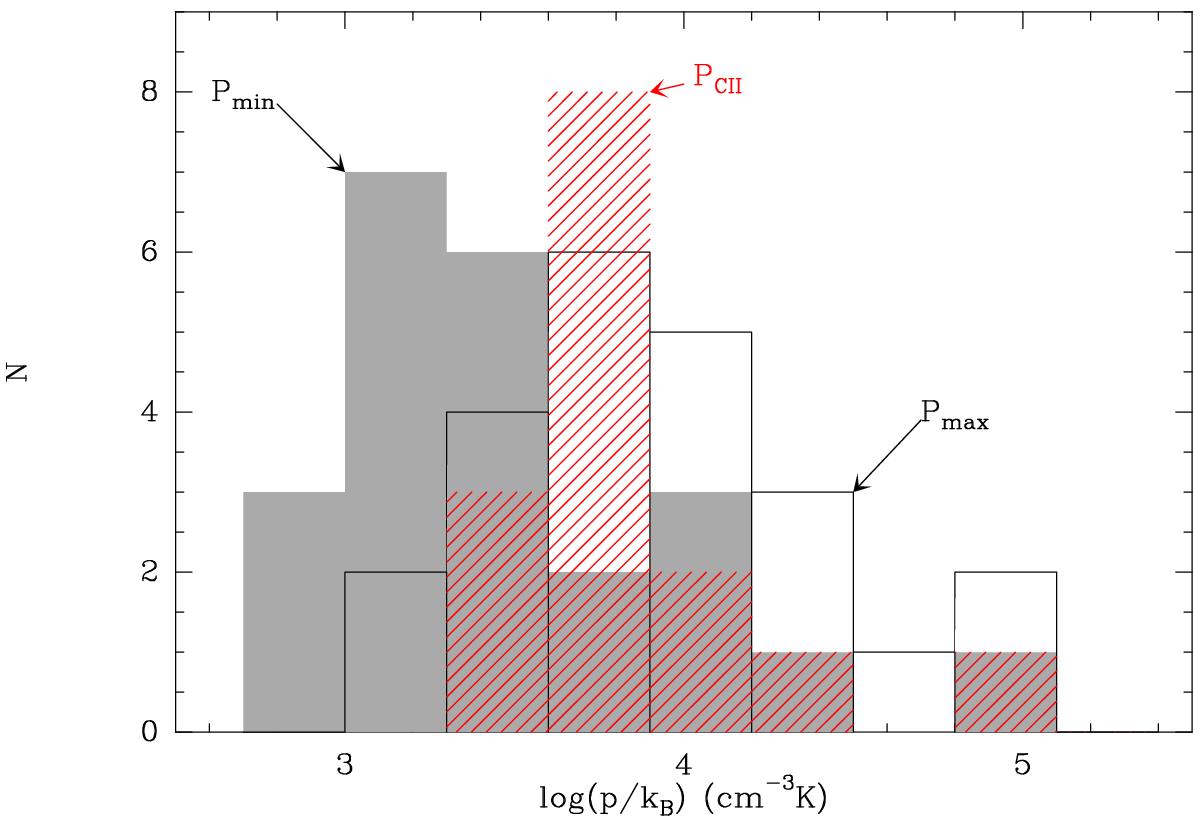
Histograms of the pressure values derived from the analysis of the [C ii] and [C i] data. The gray histogram represents the minimum values of the gas pressure derived from the [C i] data, the black lines show the maximum values also derived from [C i] and the dashed red histogram shows the pressure values derived from [C ii].
Current usage metrics show cumulative count of Article Views (full-text article views including HTML views, PDF and ePub downloads, according to the available data) and Abstracts Views on Vision4Press platform.
Data correspond to usage on the plateform after 2015. The current usage metrics is available 48-96 hours after online publication and is updated daily on week days.
Initial download of the metrics may take a while.