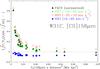
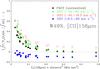
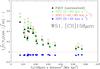
Fig. 6

Relative [C ii] emission as a function of the 158 μm continuum luminosity for W31C, W49N, and W51. For each source, the black triangles show the spectrally unresolved PACS data, the blue squares the contribution of the foreground absorption measured by HIFI, the red squares the intrinsic source emission measured by HIFI, and the green stars the total emission and absorption measured by HIFI. The velocity intervals for the integration are given in each plot. In all plots the points on the left side correspond to the map edges while those on the right side correspond to the massive star forming regions associated with the dust continuum peak.
Current usage metrics show cumulative count of Article Views (full-text article views including HTML views, PDF and ePub downloads, according to the available data) and Abstracts Views on Vision4Press platform.
Data correspond to usage on the plateform after 2015. The current usage metrics is available 48-96 hours after online publication and is updated daily on week days.
Initial download of the metrics may take a while.