Free Access
Fig. 5
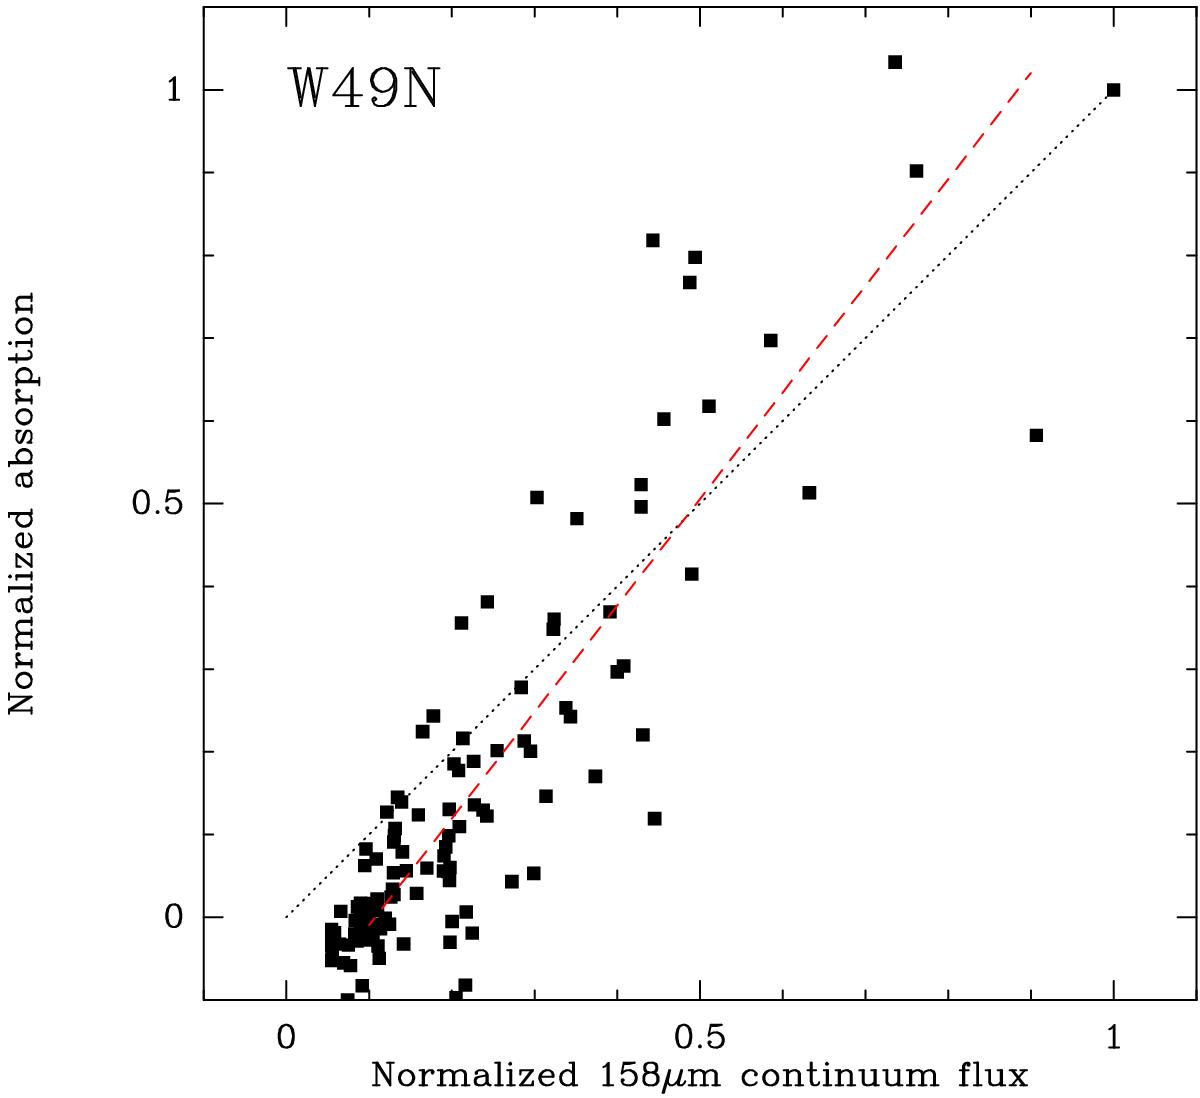
Comparison of the velocity integrated absorption (![]() ) measured in the HIFI map relative to the velocity integrated absorption at the map center, with the continuum flux measured in the PACS map relative to the map center. The dashed red line shows the linear regression line and the dotted black line a 1:1 relationship.
) measured in the HIFI map relative to the velocity integrated absorption at the map center, with the continuum flux measured in the PACS map relative to the map center. The dashed red line shows the linear regression line and the dotted black line a 1:1 relationship.
Current usage metrics show cumulative count of Article Views (full-text article views including HTML views, PDF and ePub downloads, according to the available data) and Abstracts Views on Vision4Press platform.
Data correspond to usage on the plateform after 2015. The current usage metrics is available 48-96 hours after online publication and is updated daily on week days.
Initial download of the metrics may take a while.