Free Access
Fig. 4
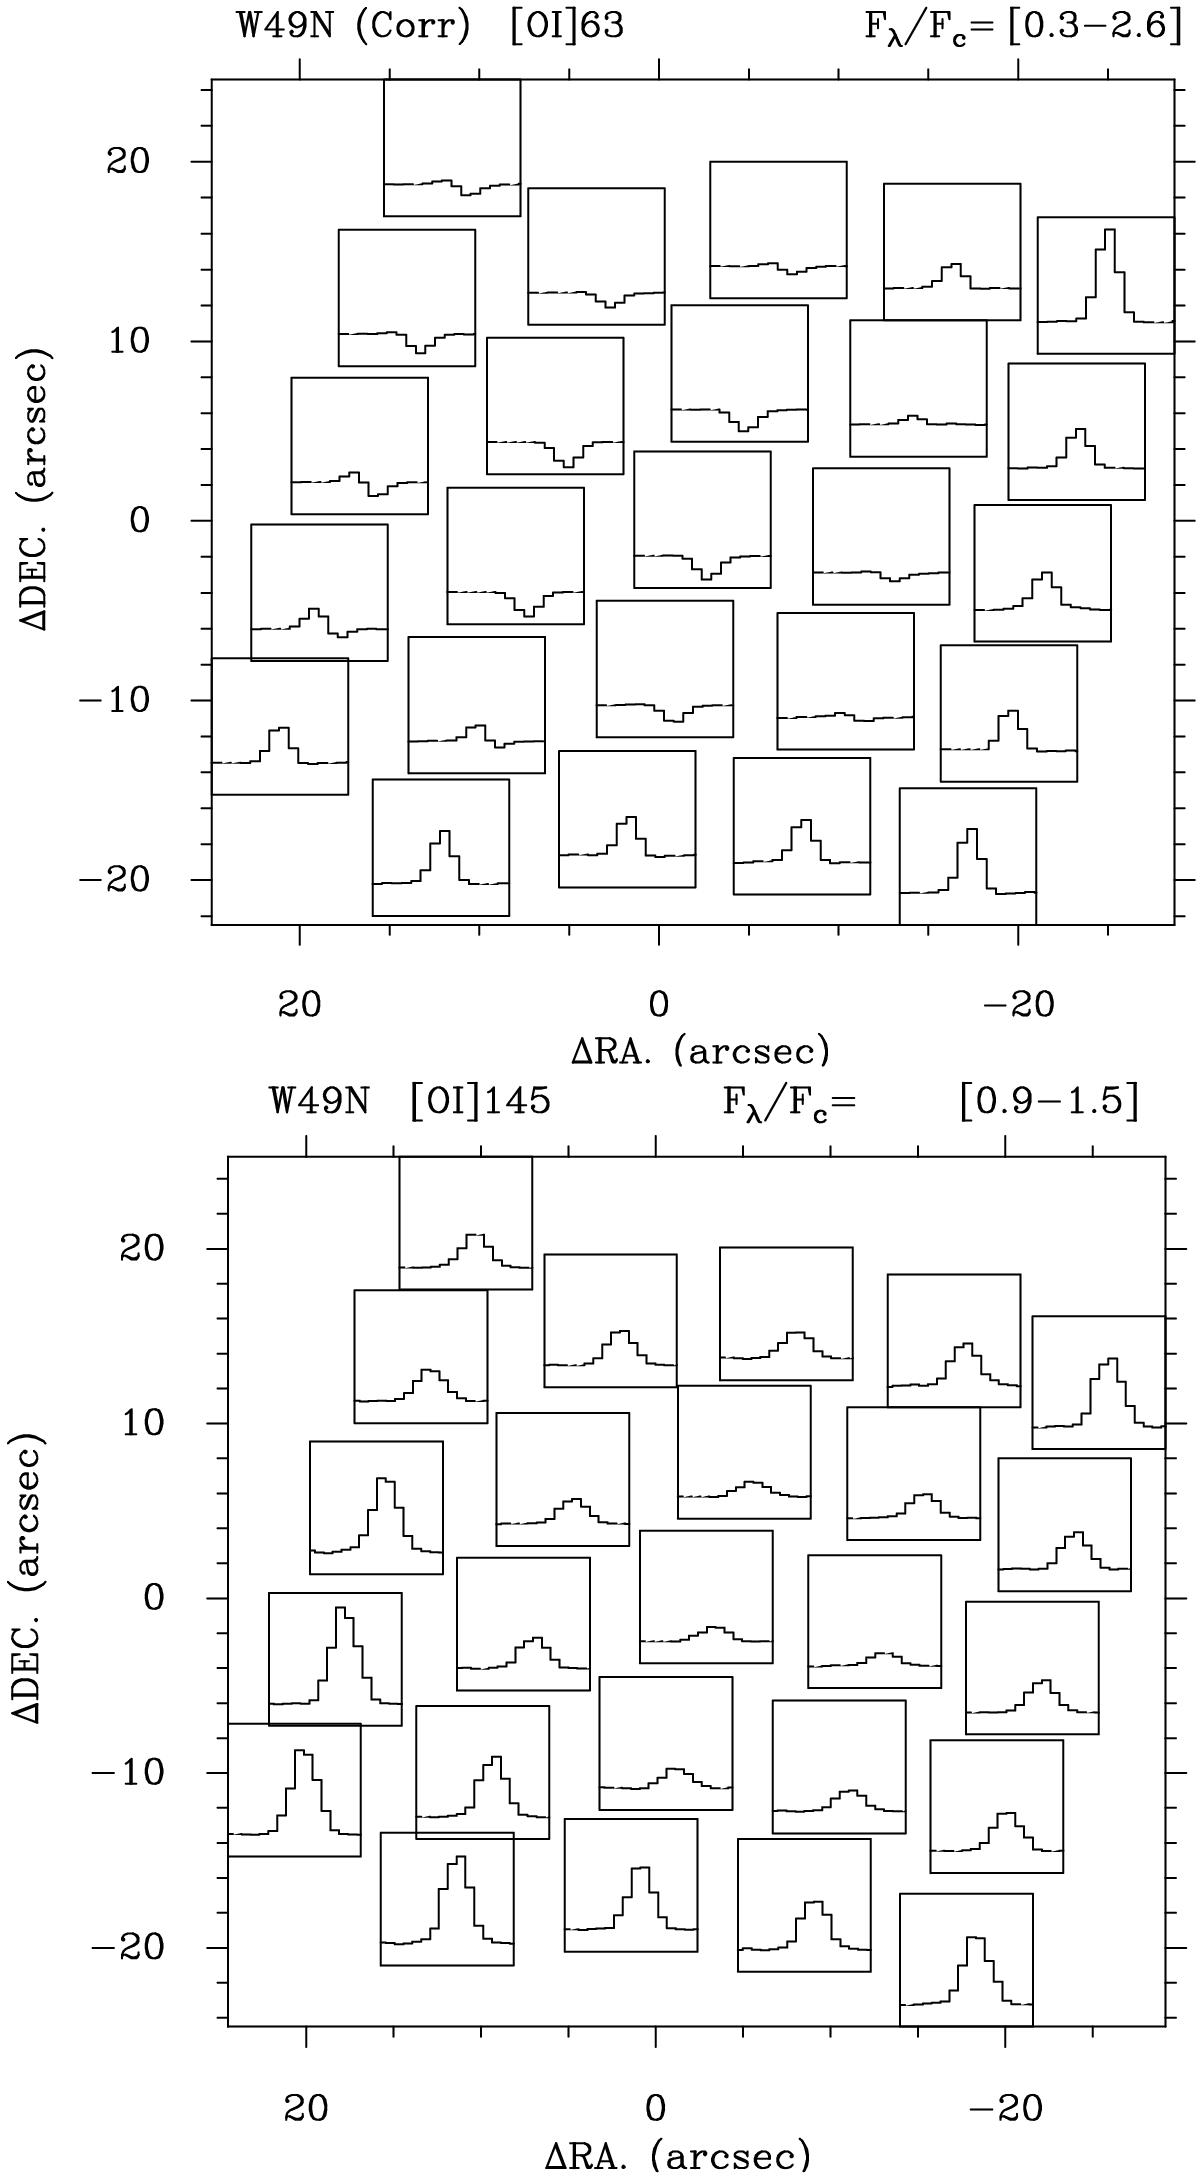
Line to continuum ratio spectral maps obtained with PACS for the oxygen fine structure lines towards W49N. Top: the ![]() line at 63 μm, Bottom: the
line at 63 μm, Bottom: the ![]() line at 145 μm. The vertical scale is indicated in each map.
line at 145 μm. The vertical scale is indicated in each map.
This figure is made of several images, please see below:
Current usage metrics show cumulative count of Article Views (full-text article views including HTML views, PDF and ePub downloads, according to the available data) and Abstracts Views on Vision4Press platform.
Data correspond to usage on the plateform after 2015. The current usage metrics is available 48-96 hours after online publication and is updated daily on week days.
Initial download of the metrics may take a while.