Free Access
Fig. 4
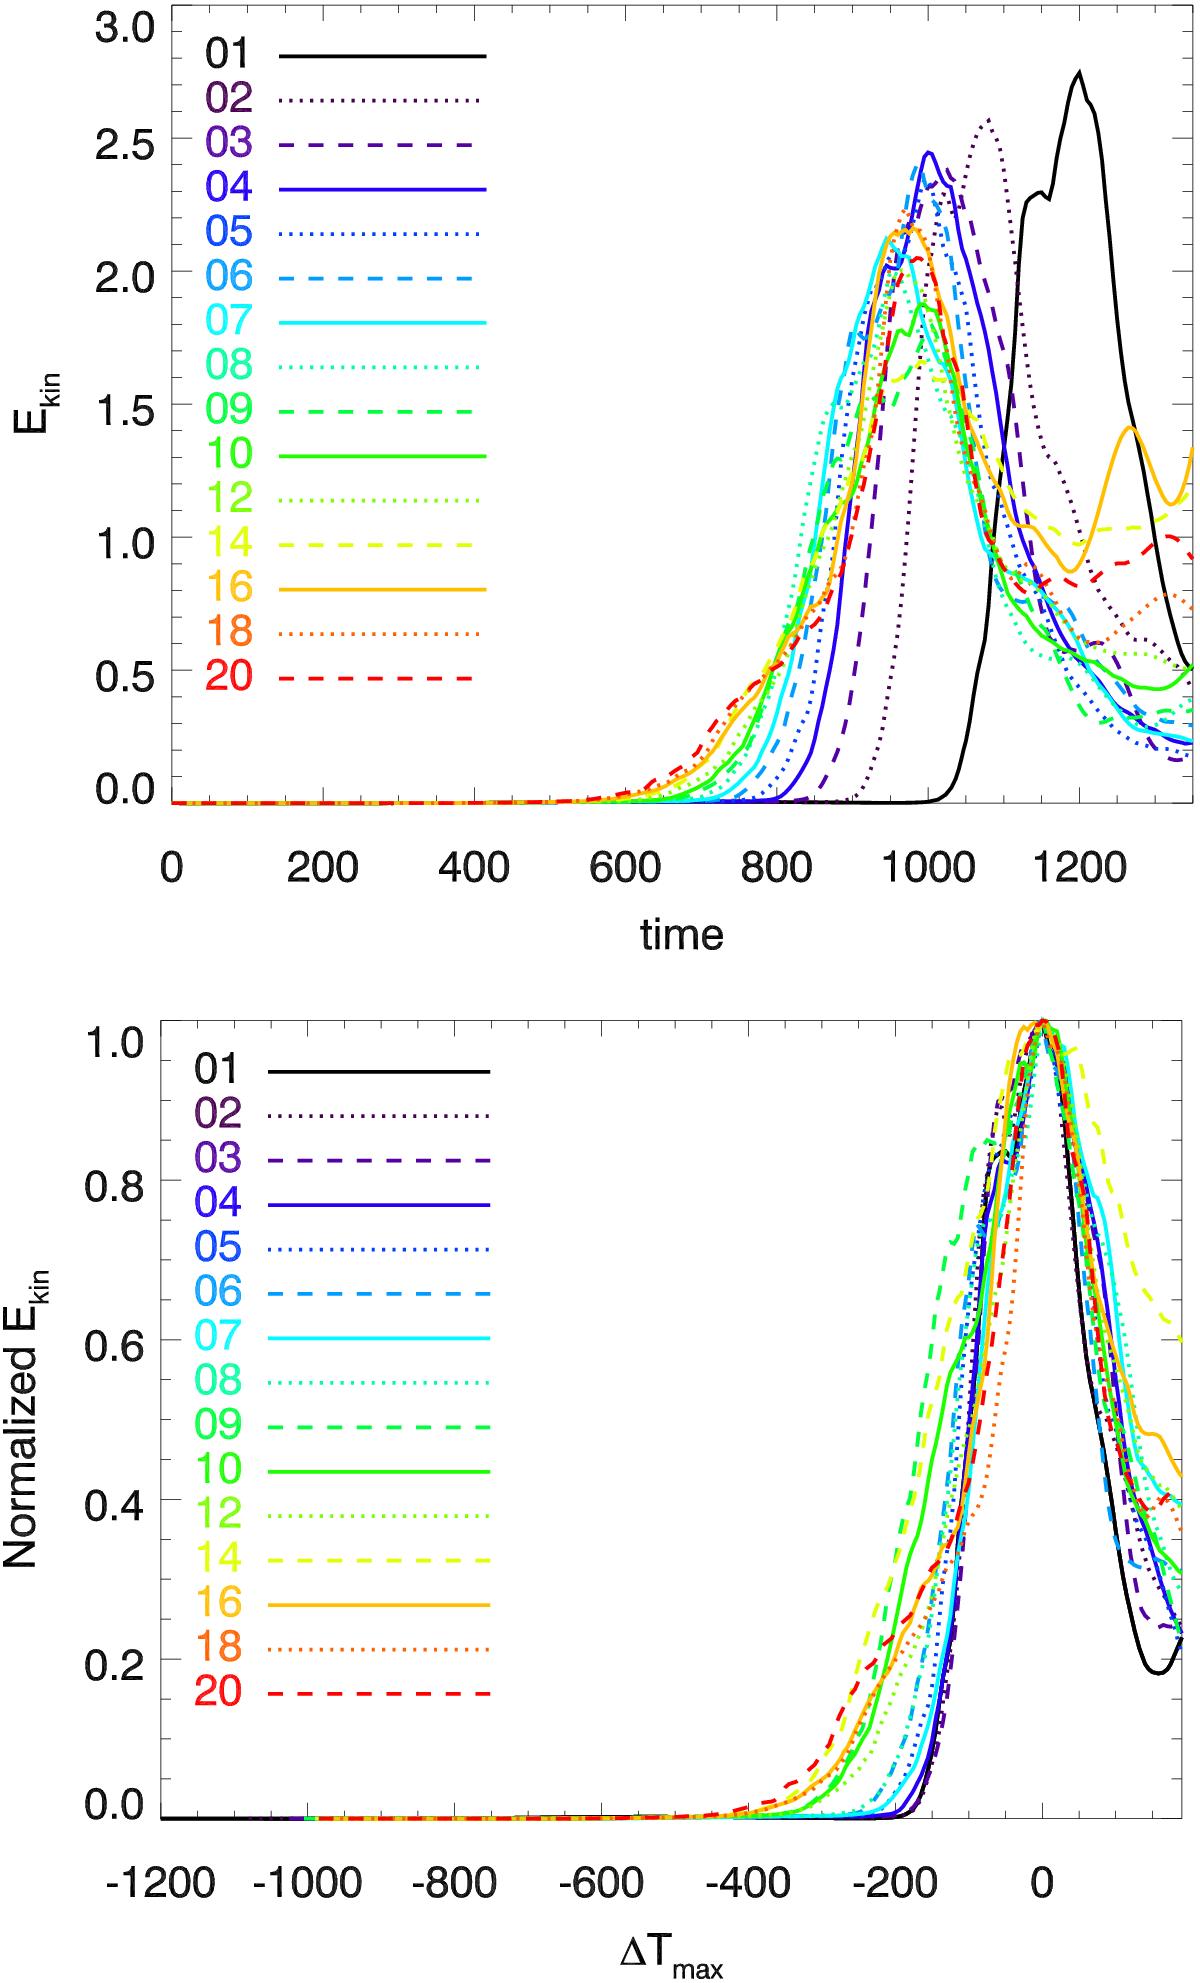
Top panel: evolution of the kinetic energy for simulations with different values of the inclination angle θ. Bottom panel: evolution of the normalized kinetic energy (see text), where Δt = 0 at the time of peak kinetic energy in each simulation.
This figure is made of several images, please see below:
Current usage metrics show cumulative count of Article Views (full-text article views including HTML views, PDF and ePub downloads, according to the available data) and Abstracts Views on Vision4Press platform.
Data correspond to usage on the plateform after 2015. The current usage metrics is available 48-96 hours after online publication and is updated daily on week days.
Initial download of the metrics may take a while.