Fig. 3
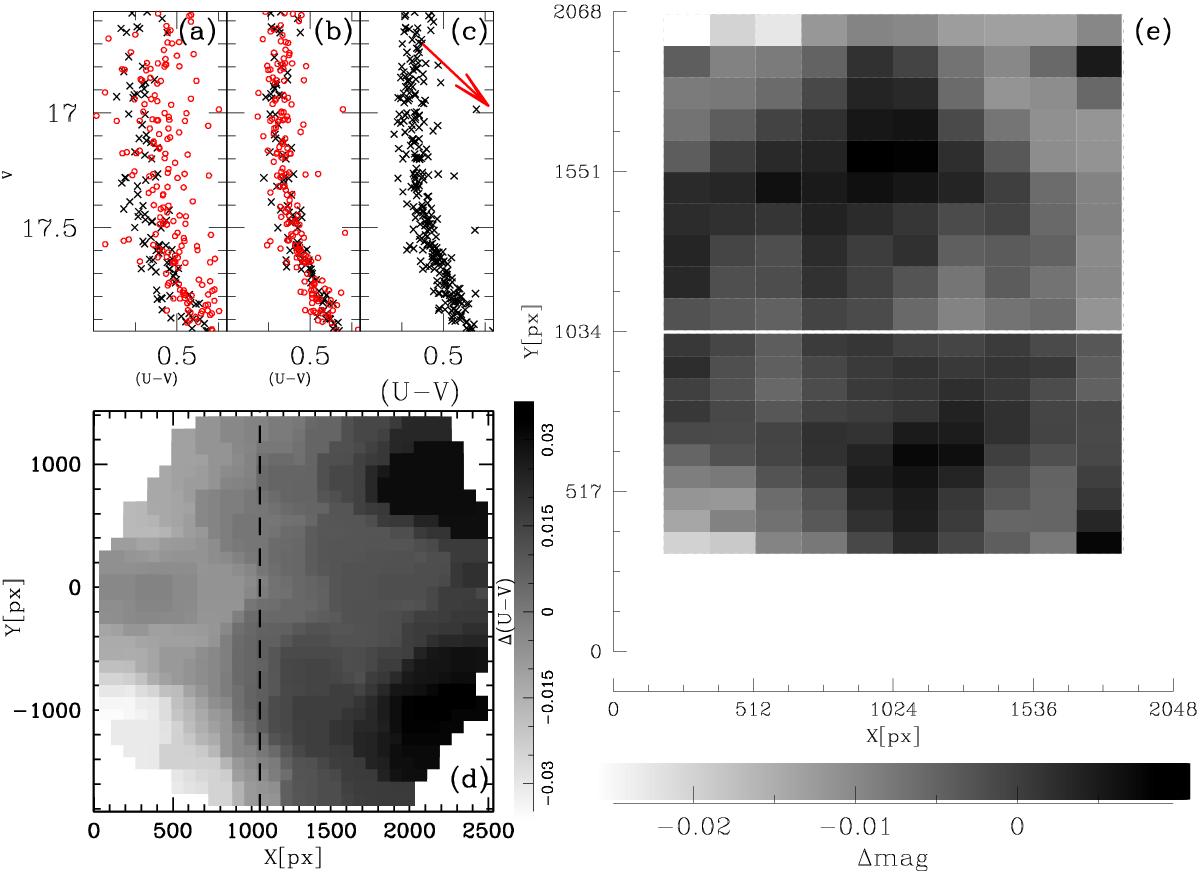
Visualization of the effects of the photometric zero-point variation. Panel a): CMDs zoomed into the MS region of NGC 6397 before the zero-point correction; panel b): CMD after the zero-point correction; panel c): CMD after the differential reddening correction (in red the reddening vector, scaled by a factor 1/3); panel d) map of the color zero-point variation; the dashed line divide the two groups of stars shown in the panels a) and b); panel e): final Δmag correction grid for the filter v_HIGH and the NGC 6397 data set.
Current usage metrics show cumulative count of Article Views (full-text article views including HTML views, PDF and ePub downloads, according to the available data) and Abstracts Views on Vision4Press platform.
Data correspond to usage on the plateform after 2015. The current usage metrics is available 48-96 hours after online publication and is updated daily on week days.
Initial download of the metrics may take a while.