Fig. 2
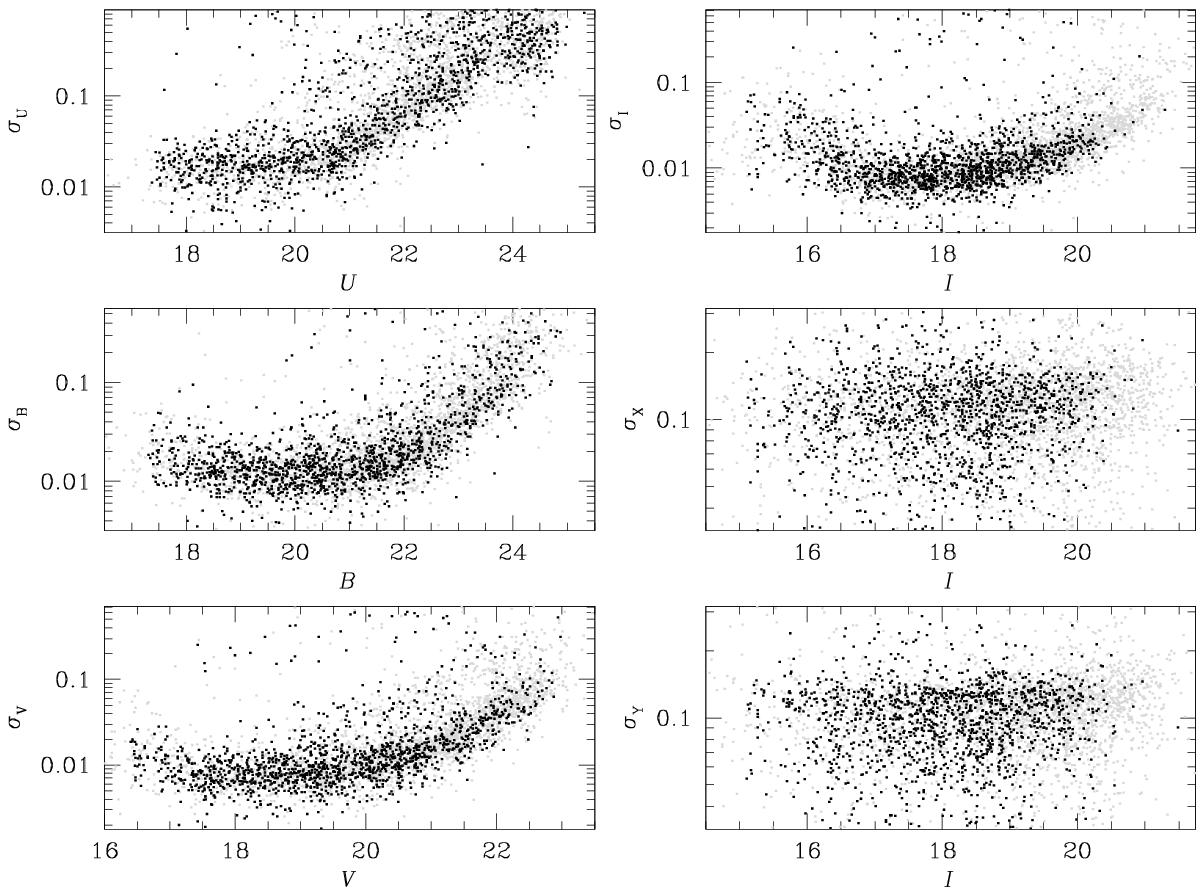
Photometric (left panels and top right panel) and position residuals (middle and bottom right panels) from single measurements in the single images of NGC 6121 plotted as a function of the average magnitude. Gray points show all detected stars; black points refer to proper motion selected stars. In the case of NGC 6752 and NGC 6397, the distributions are similar.
Current usage metrics show cumulative count of Article Views (full-text article views including HTML views, PDF and ePub downloads, according to the available data) and Abstracts Views on Vision4Press platform.
Data correspond to usage on the plateform after 2015. The current usage metrics is available 48-96 hours after online publication and is updated daily on week days.
Initial download of the metrics may take a while.