Free Access
Fig. 17
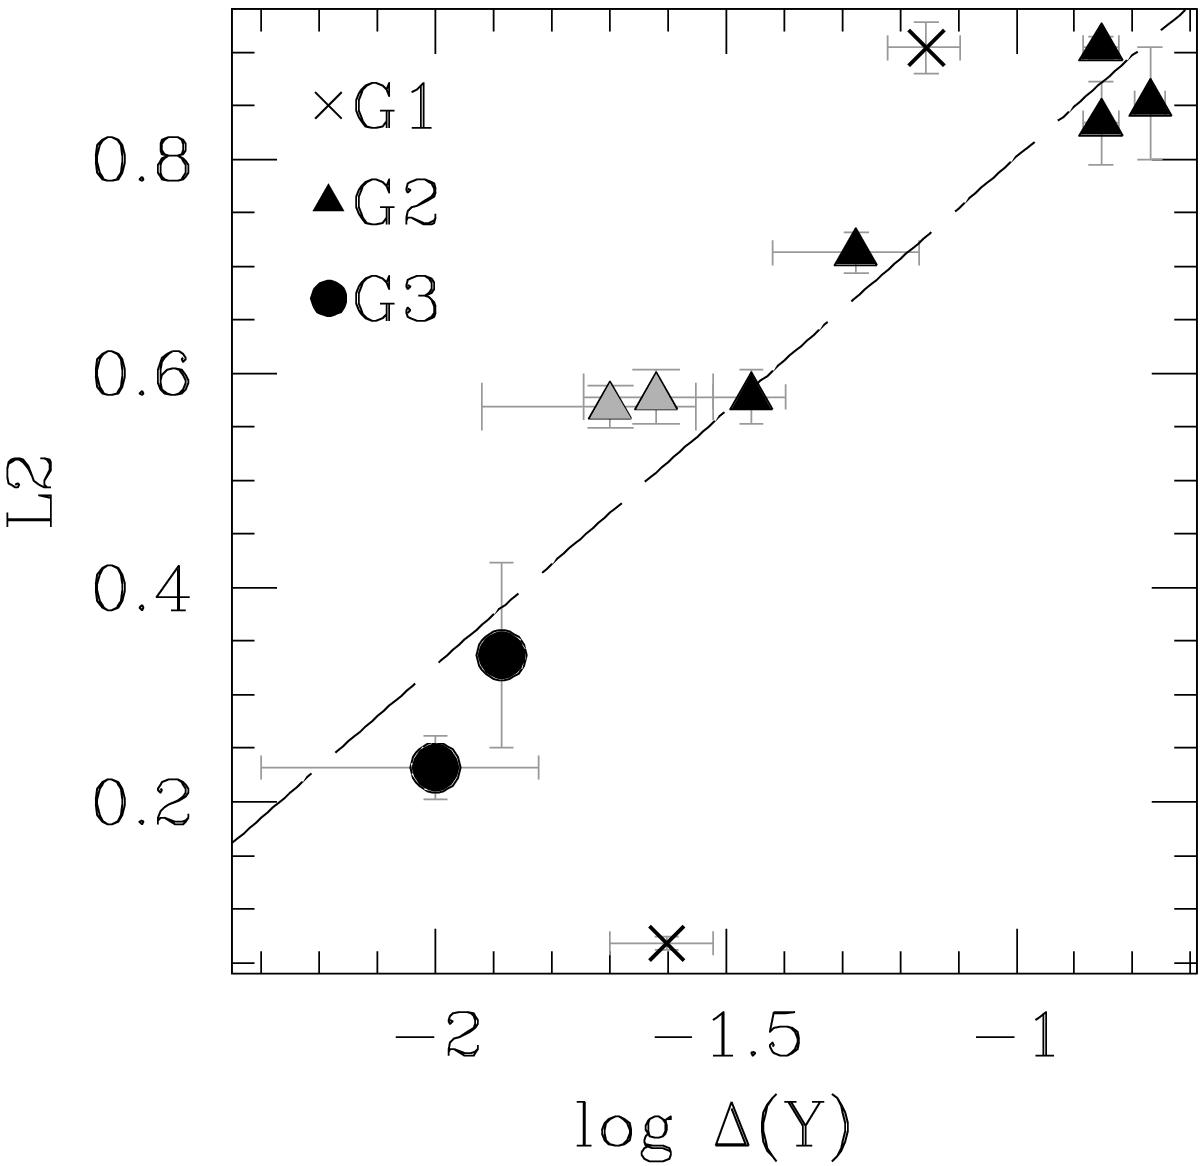
The HB morphological parameter L2 as a function of the logarithm of the maximum helium difference among stellar populations in GCs. The black line is the best-fitting straight line for G2+G3 GCs. The data of Milone et al. (2014b) are in black, the data of this work in gray.
Current usage metrics show cumulative count of Article Views (full-text article views including HTML views, PDF and ePub downloads, according to the available data) and Abstracts Views on Vision4Press platform.
Data correspond to usage on the plateform after 2015. The current usage metrics is available 48-96 hours after online publication and is updated daily on week days.
Initial download of the metrics may take a while.