Fig. 13
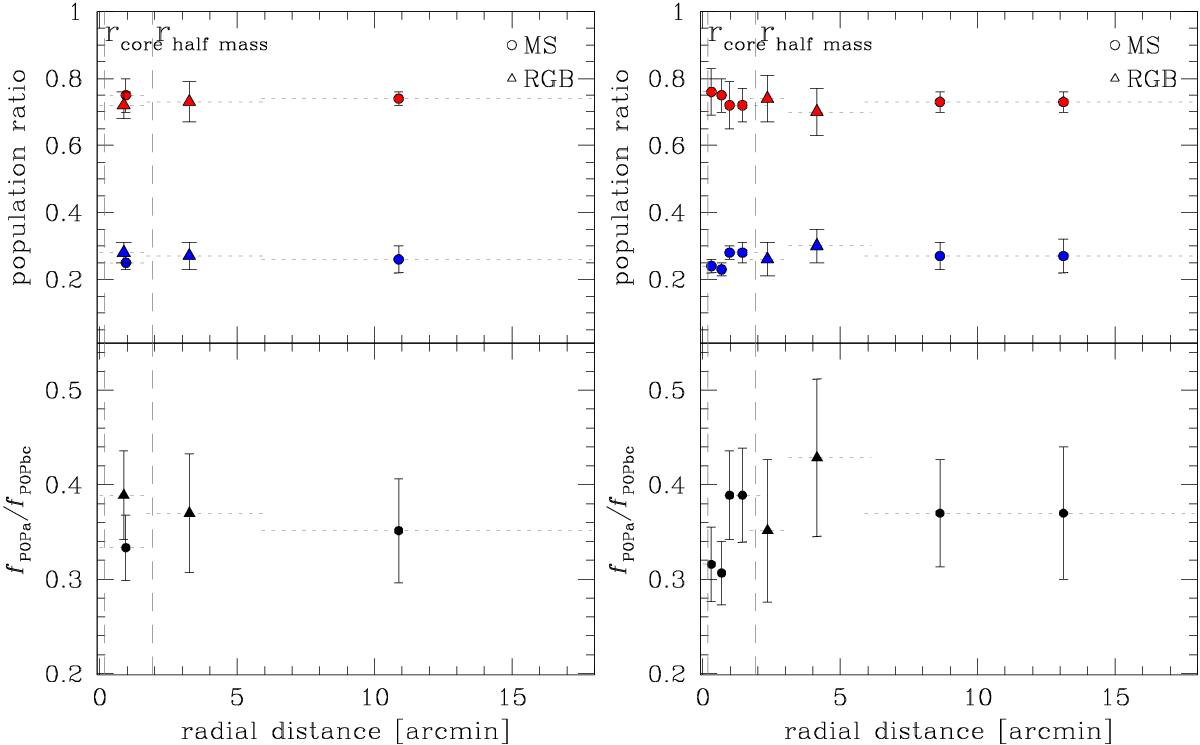
Top: radial distribution of the fraction of population “a” (blue) and “b”+“c” (red) stars with respect the total number of stars. Bottom: radial trend of the ratio between fPOPa and fPOPbc stars. At left, we consider single radial interval for each set of data, while in the right panel we divide the radial interval in different bins. The distribution seems to be flat in both cases.
Current usage metrics show cumulative count of Article Views (full-text article views including HTML views, PDF and ePub downloads, according to the available data) and Abstracts Views on Vision4Press platform.
Data correspond to usage on the plateform after 2015. The current usage metrics is available 48-96 hours after online publication and is updated daily on week days.
Initial download of the metrics may take a while.