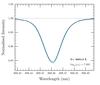
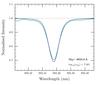
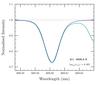
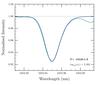
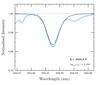
Fig. 1
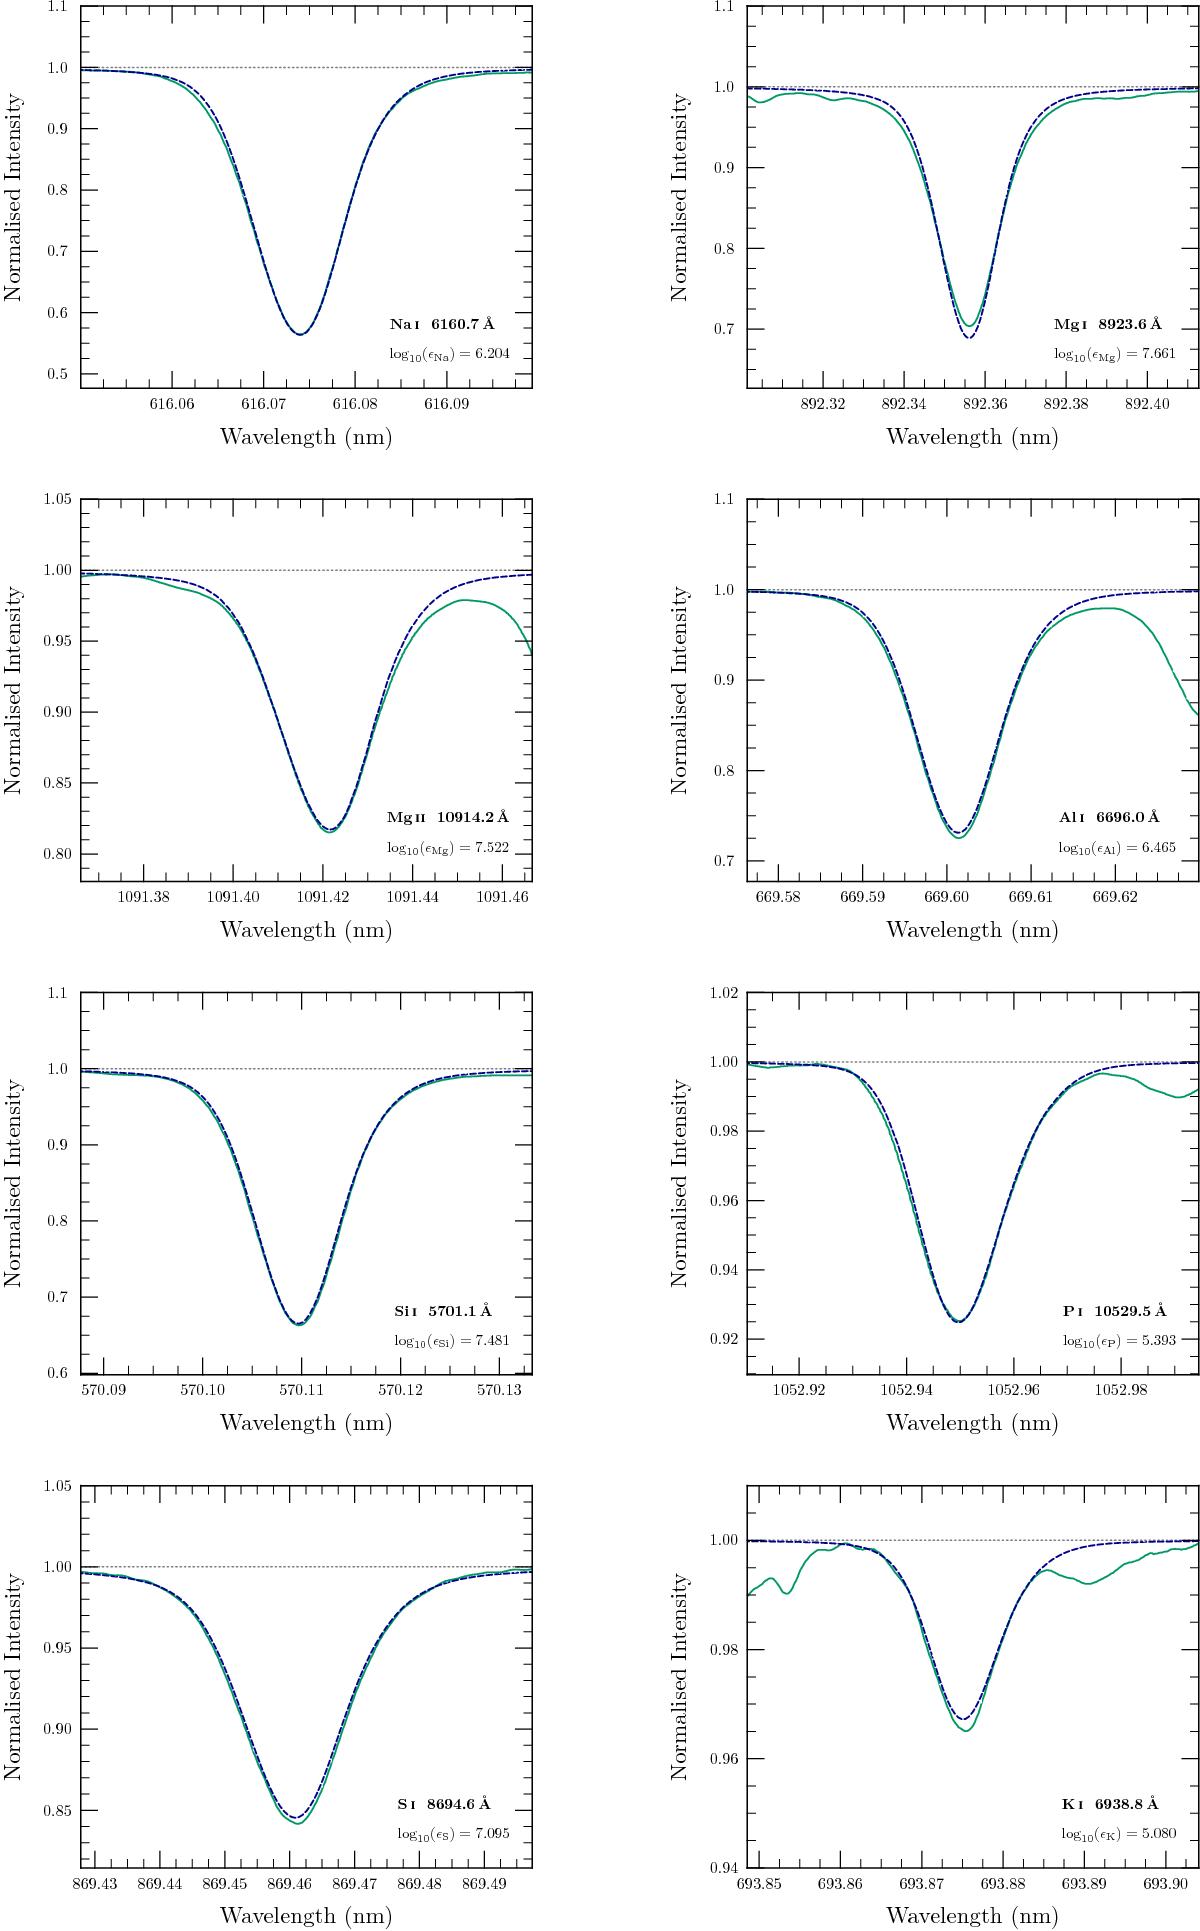
Example spatially and temporally averaged, disc-centre synthesised Na i, Mg i, Mg ii, Al i, Si i, P i, S i and K i line profiles (blue dashed), shown in comparison to the observed Kitt Peak FTS profile (solid green). We removed the solar gravitational redshift from the FTS spectrum, convolved the synthesised profile with an instrumental sinc function and fitted it in abundance. In some cases the observed spectra have been adjusted slightly in wavelength and continuum placements relative to the published solar atlas. The 3D line profiles shown are the 3D LTE results, whereas the quoted abundance in each panel includes the NLTE abundance correction from Table 2.
Current usage metrics show cumulative count of Article Views (full-text article views including HTML views, PDF and ePub downloads, according to the available data) and Abstracts Views on Vision4Press platform.
Data correspond to usage on the plateform after 2015. The current usage metrics is available 48-96 hours after online publication and is updated daily on week days.
Initial download of the metrics may take a while.