Fig. 2
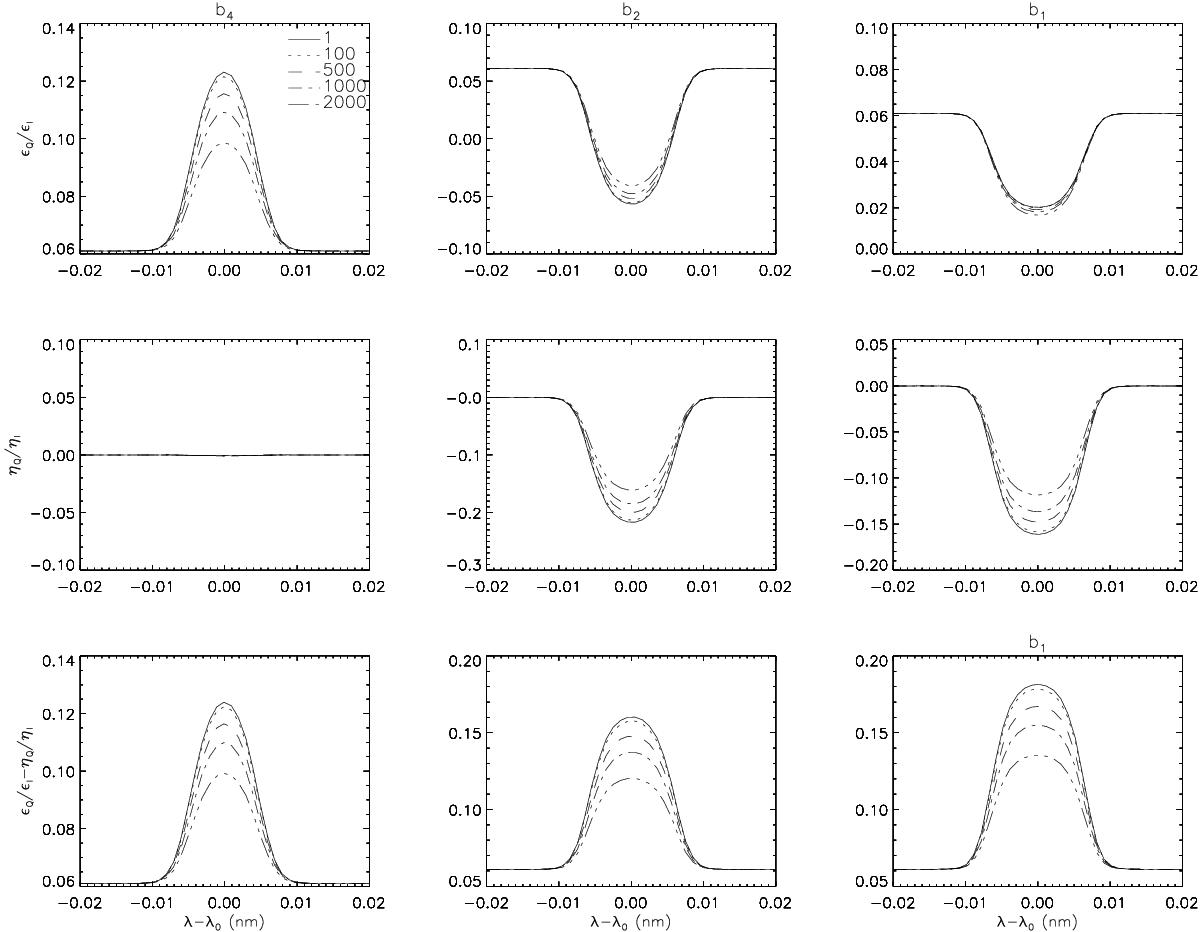
Inelastic collision influence on Q/I
profiles of the Mg I triplet. The solid, dotted, dashed, dot-dashed, and
triple-dot-dashed lines result from the factor ε′ = 1,
100, 500, 1000, and 2000, respectively. In the top panels
ϵQ/ϵI
profiles are plotted, ηQ/ηI
profiles are depicted in the middle panels, and in the
bottom panels ϵQ/ϵI
−
ηQ/ηI
profiles are presented. The continuum intensity corresponds to
![]() .
.
Current usage metrics show cumulative count of Article Views (full-text article views including HTML views, PDF and ePub downloads, according to the available data) and Abstracts Views on Vision4Press platform.
Data correspond to usage on the plateform after 2015. The current usage metrics is available 48-96 hours after online publication and is updated daily on week days.
Initial download of the metrics may take a while.