Fig. 7
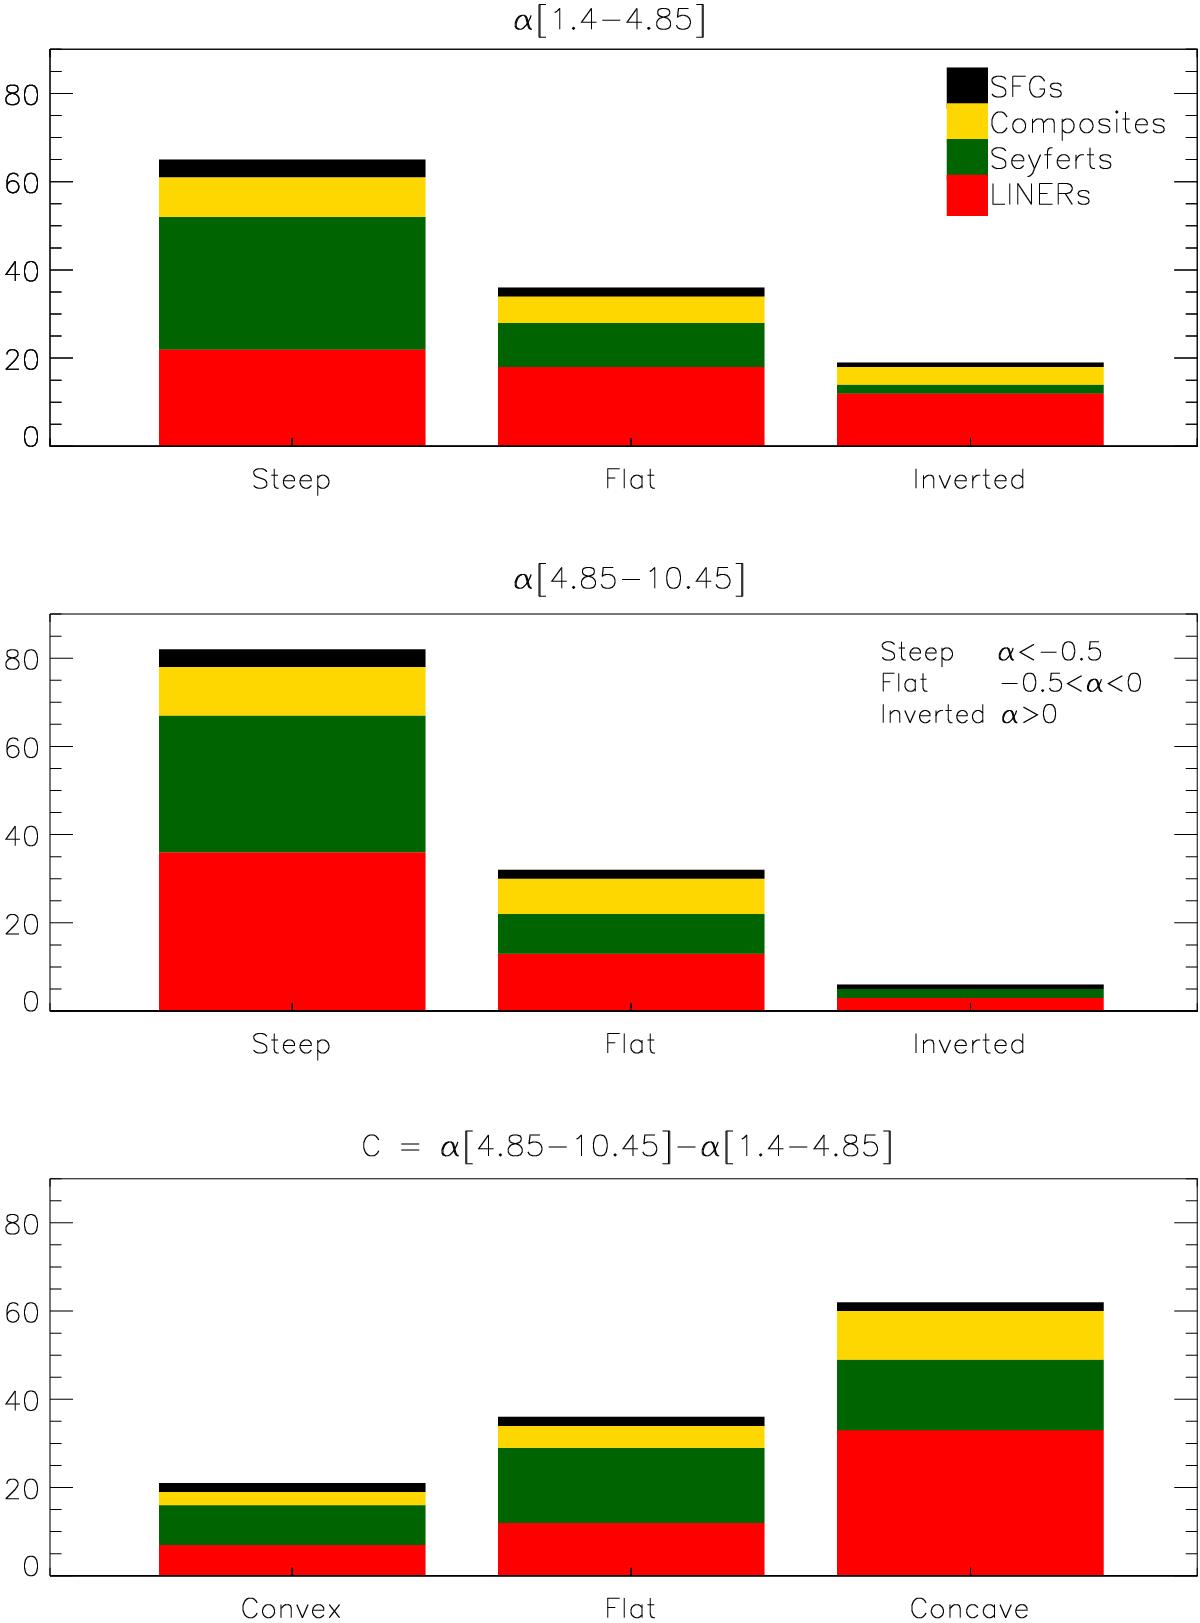
Spectral indices and spectral curvature for each spectral class. The top panel shows the cumulative histograms of the spectral index α[ 1.4−4.85 ], while the middle panel shows α[ 4.85−10.45 ]. Spectra are classified as steep, flat, or inverted. The bottom panel shows the spectral curvature (C), defined as the difference between α[ 4.85−10.45 ] (higher frequency) and α[ 1.4−4.85 ] (lower frequency).
Current usage metrics show cumulative count of Article Views (full-text article views including HTML views, PDF and ePub downloads, according to the available data) and Abstracts Views on Vision4Press platform.
Data correspond to usage on the plateform after 2015. The current usage metrics is available 48-96 hours after online publication and is updated daily on week days.
Initial download of the metrics may take a while.