Fig. 5
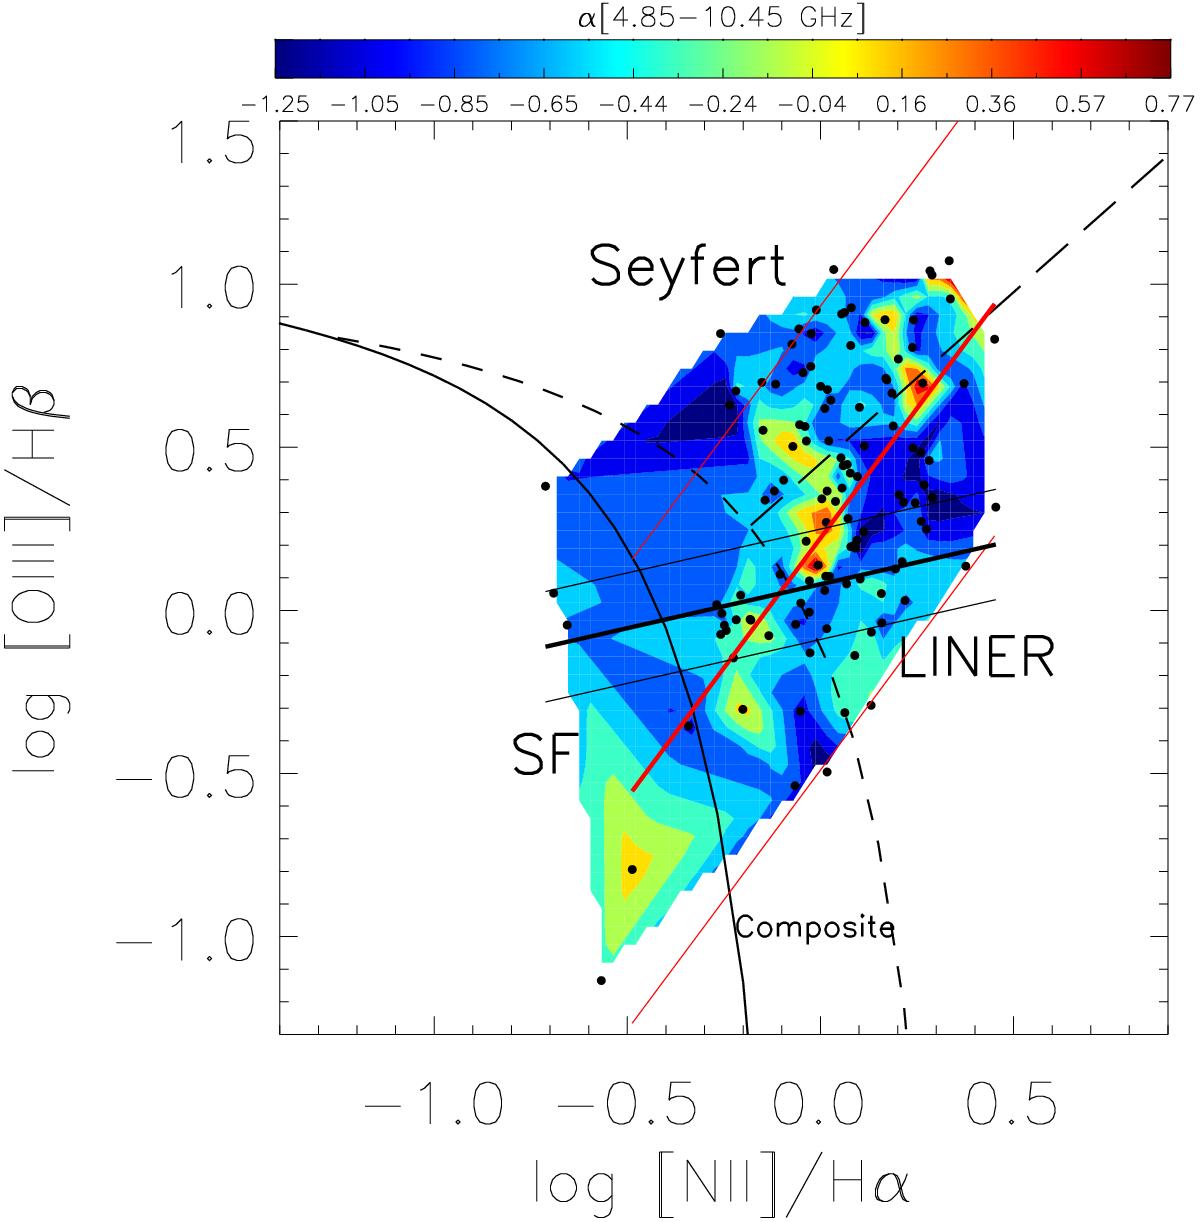
Two-point spectral index distribution of the Effelsberg sample represented in the [NII]-based diagnostic diagram. The color gradient indicates the α[ 4.85−10.45 ] values. Black dots correspond to sources positions in the diagram. Red thick lines are regression curves of the 15% most flat- and inverted-spectrum sources, while black thick lines are regression curves of the steep-spectrum sources. ± 1σ of regression curves are represented by the outer red and black lines.
Current usage metrics show cumulative count of Article Views (full-text article views including HTML views, PDF and ePub downloads, according to the available data) and Abstracts Views on Vision4Press platform.
Data correspond to usage on the plateform after 2015. The current usage metrics is available 48-96 hours after online publication and is updated daily on week days.
Initial download of the metrics may take a while.