Fig. 3
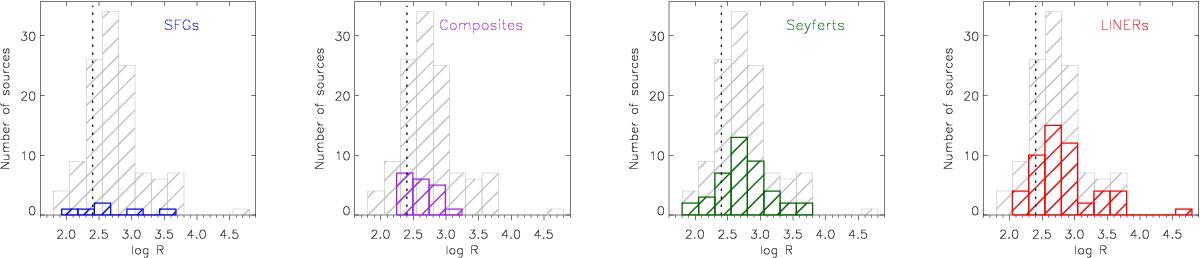
Radio-loudness distribution for each spectral kind as classified by the [NII]-based diagram. SFGs are in blue, composites in purple, Seyferts in green and LINERs in red. In each panel, sources to the left of the dashed line (log R = 2.4) are radio quiet, while sources to the right are radio loud (Panessa et al. 2007). The overall Effelsberg sample is shown in gray.
Current usage metrics show cumulative count of Article Views (full-text article views including HTML views, PDF and ePub downloads, according to the available data) and Abstracts Views on Vision4Press platform.
Data correspond to usage on the plateform after 2015. The current usage metrics is available 48-96 hours after online publication and is updated daily on week days.
Initial download of the metrics may take a while.