Fig. 13
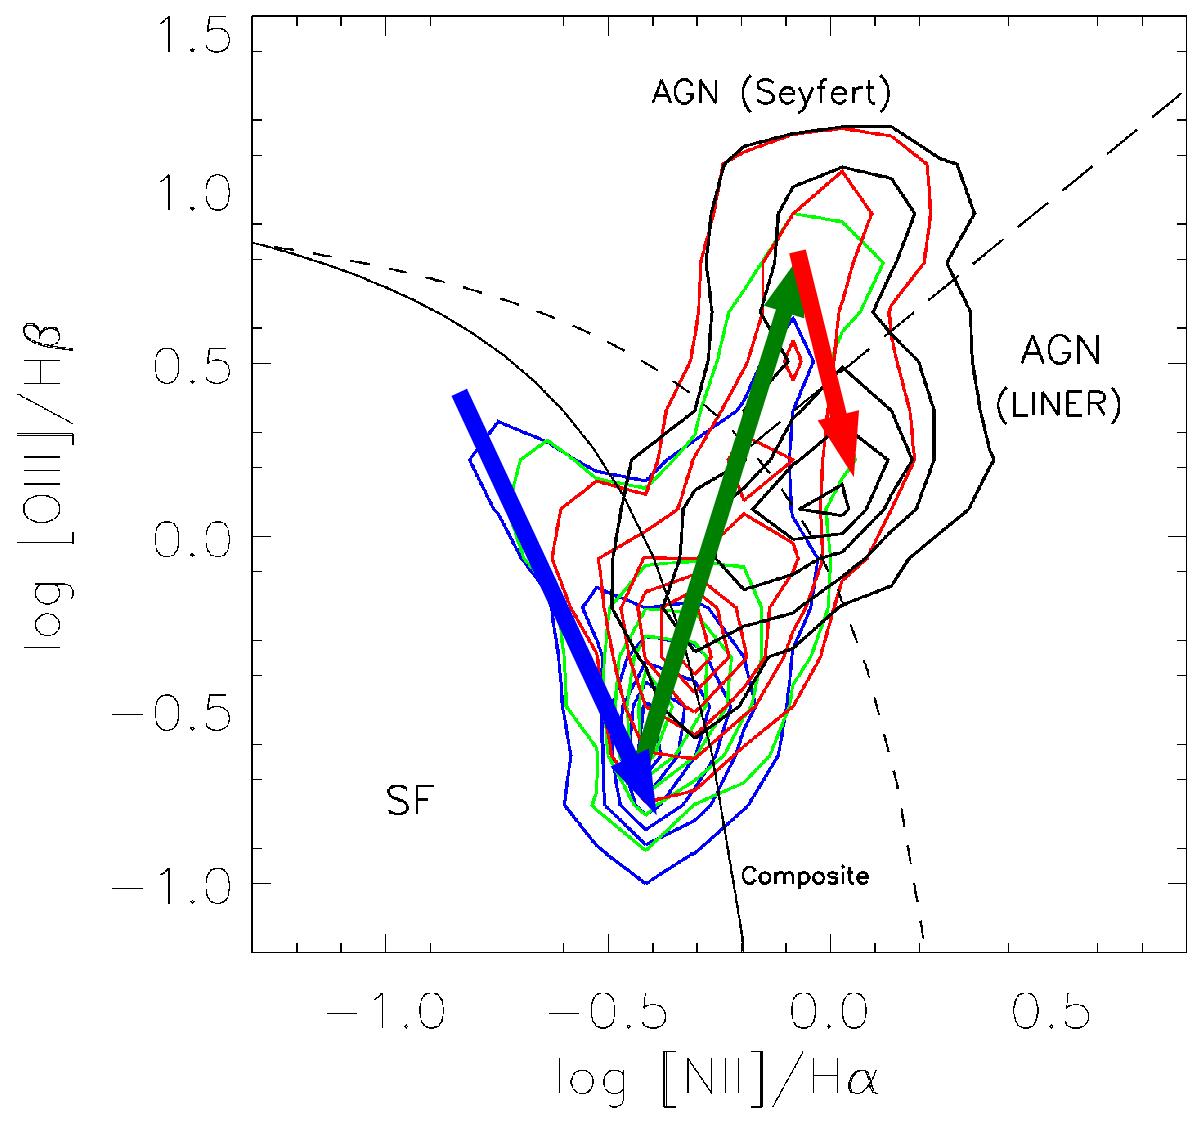
Sketch of galaxy evolution across the [NII]-based diagnostic diagram. Color contours represent sub-samples of the parent sample with increasing values (blue, green, red, and black) of the ratio between radio luminosity and luminosity of the Hα line as in Vitale et al. (2012). The arrows represent the trend of possible galaxy evolution from star-forming galaxies to Seyferts and LINERs.
Current usage metrics show cumulative count of Article Views (full-text article views including HTML views, PDF and ePub downloads, according to the available data) and Abstracts Views on Vision4Press platform.
Data correspond to usage on the plateform after 2015. The current usage metrics is available 48-96 hours after online publication and is updated daily on week days.
Initial download of the metrics may take a while.