Free Access
Fig. 8
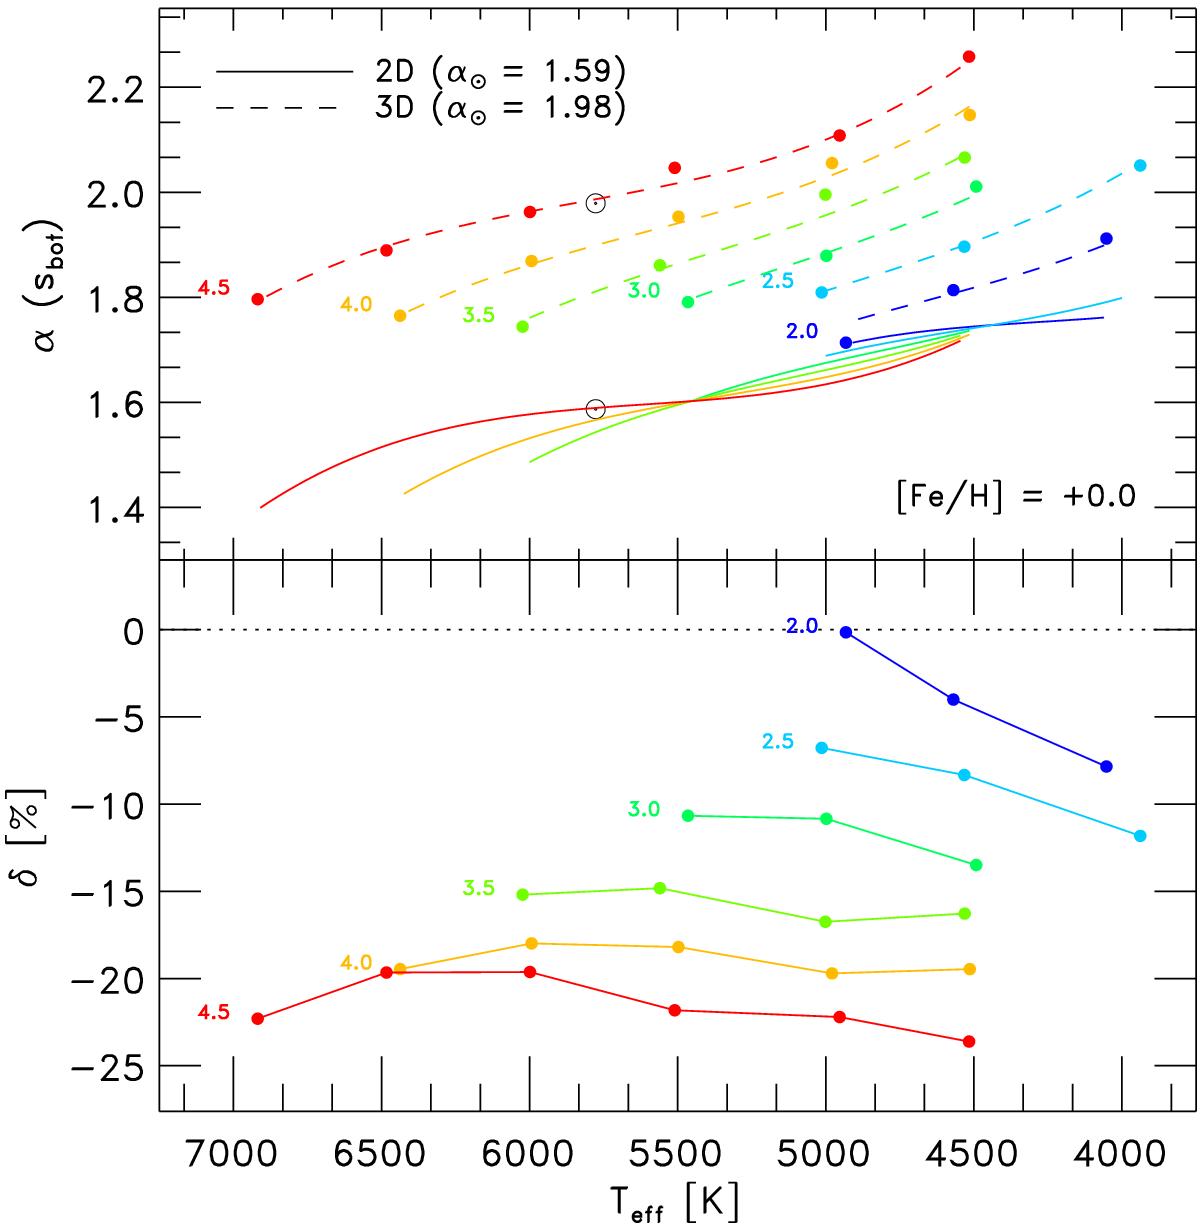
Top panel: calibration of αMLT with 2D (Ludwig et al. 1999) and 3D simulations in comparison (solid and dashed lines, respectively). The surface gravity is indicated and color-coded. The solar values are indicated. Bottom panel: relative differences (δ = 2D/3D − 1).
Current usage metrics show cumulative count of Article Views (full-text article views including HTML views, PDF and ePub downloads, according to the available data) and Abstracts Views on Vision4Press platform.
Data correspond to usage on the plateform after 2015. The current usage metrics is available 48-96 hours after online publication and is updated daily on week days.
Initial download of the metrics may take a while.