Fig. 2
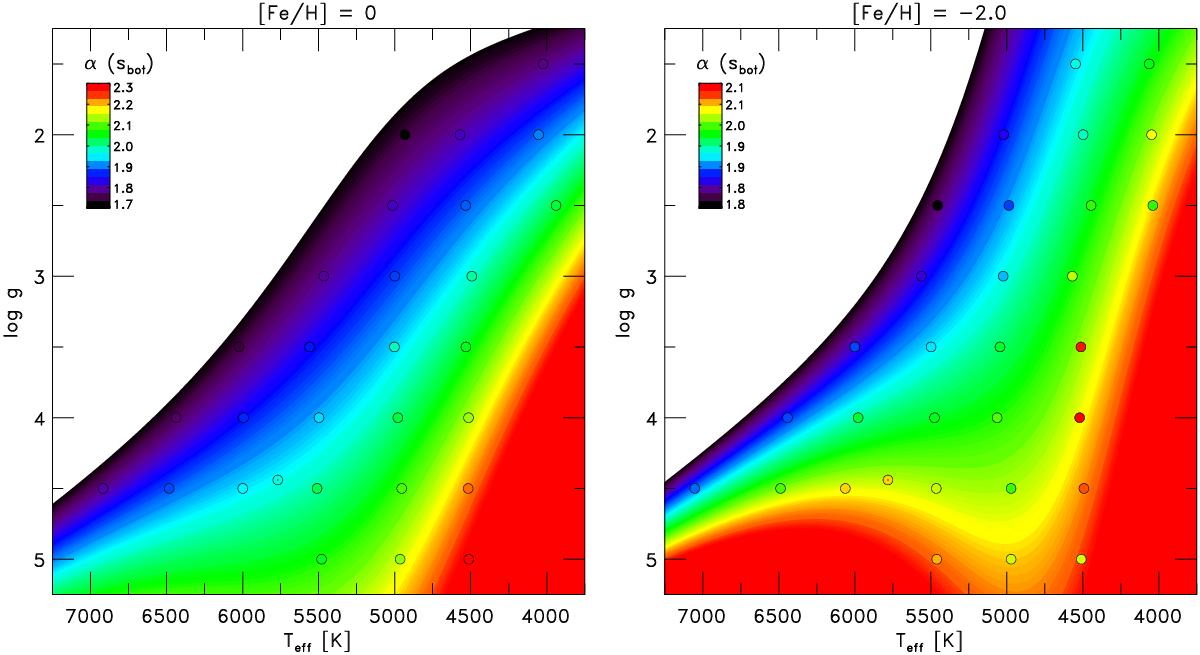
Kiel-diagram (Teff − log g diagram) with the mixing length parameter calibrated with the constant entropy value of the adiabatic convection zone, ![]() , for solar and subsolar metallicity (left and right panels, respectively). The mixing length is color-coded as indicated and shown with contours derived from functional fits (see Appendix B), while the circles represent the Stagger-grid models. Note the difference in the color scales.
, for solar and subsolar metallicity (left and right panels, respectively). The mixing length is color-coded as indicated and shown with contours derived from functional fits (see Appendix B), while the circles represent the Stagger-grid models. Note the difference in the color scales.
Current usage metrics show cumulative count of Article Views (full-text article views including HTML views, PDF and ePub downloads, according to the available data) and Abstracts Views on Vision4Press platform.
Data correspond to usage on the plateform after 2015. The current usage metrics is available 48-96 hours after online publication and is updated daily on week days.
Initial download of the metrics may take a while.