Fig. 6
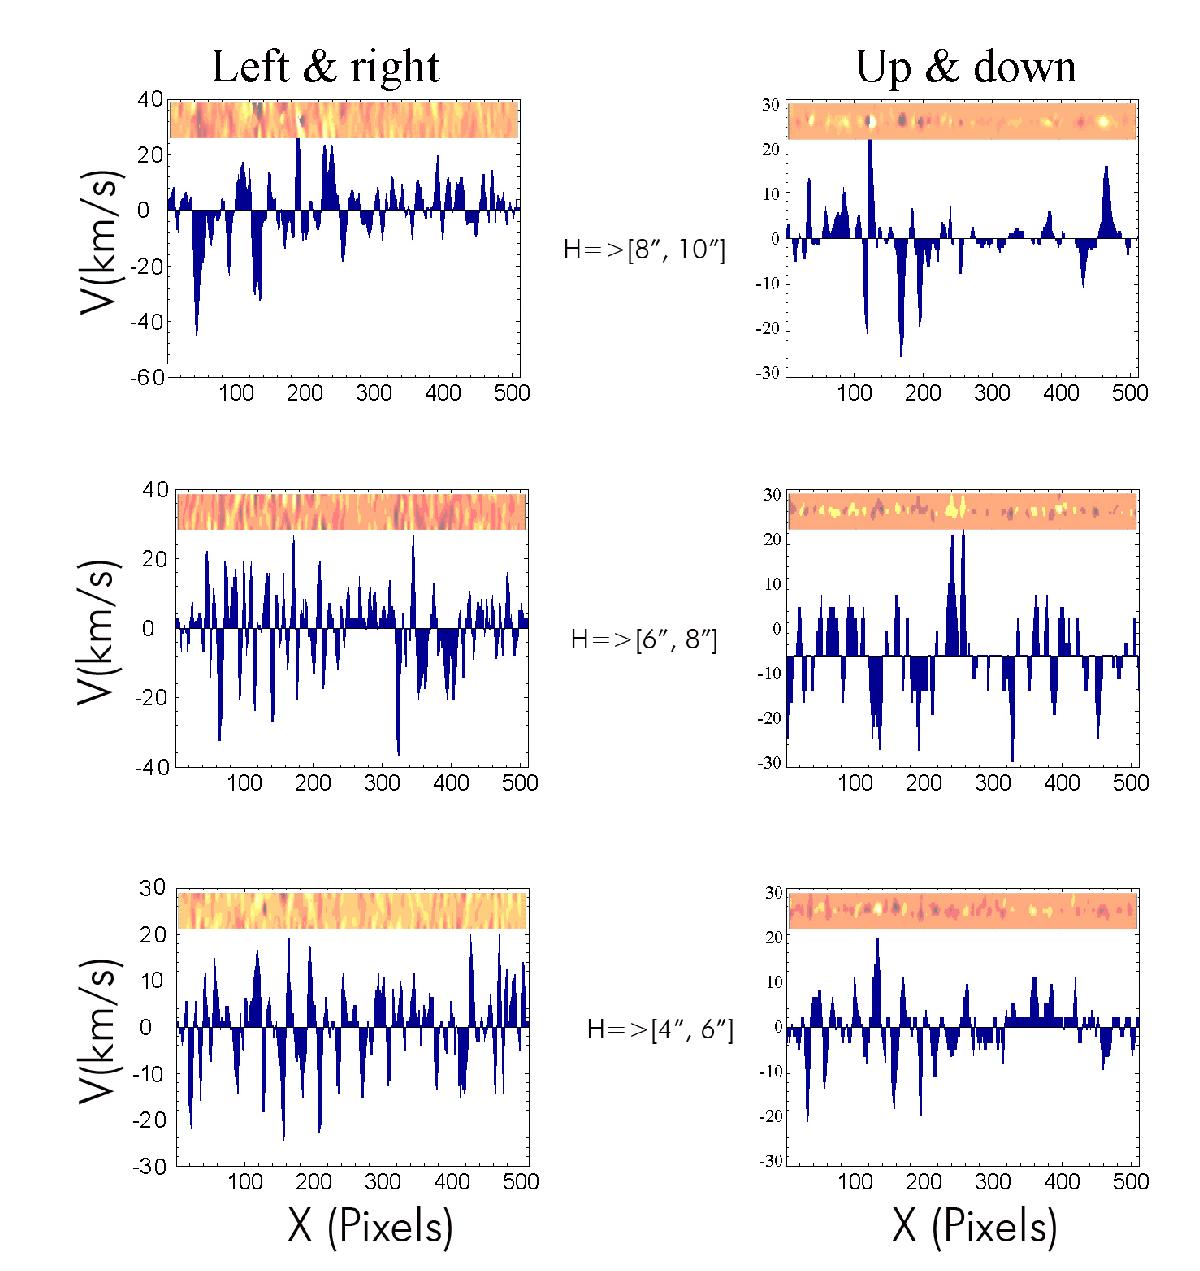
Distribution of horizontal and vertical proper motion velocities for different layers or slices above the limb as given by the height H in arcsec above the surface (limb) as observed on 17 June 2011. The orange band at the top shows the area selected at different heights, and the plots show the dispersion around the mean values.
Current usage metrics show cumulative count of Article Views (full-text article views including HTML views, PDF and ePub downloads, according to the available data) and Abstracts Views on Vision4Press platform.
Data correspond to usage on the plateform after 2015. The current usage metrics is available 48-96 hours after online publication and is updated daily on week days.
Initial download of the metrics may take a while.