Free Access
Fig. 4
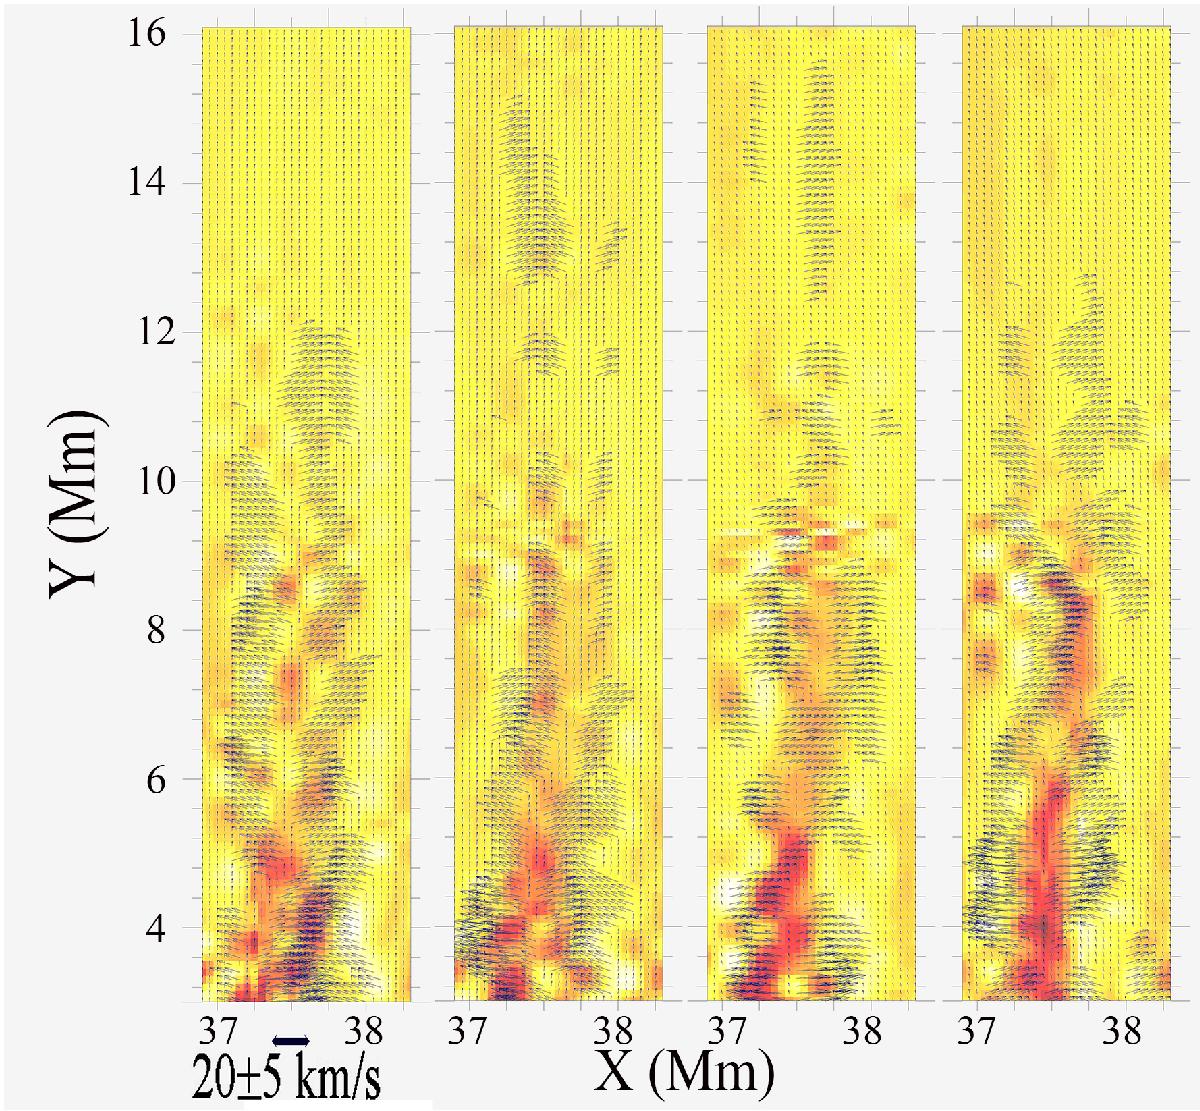
Selected frames from the left top first row of the preceding Fig. 3. The scale of apparent velocities is shown at the bottom using a small black bar put over the typical value affected by an error of ±5 km s-1.
Current usage metrics show cumulative count of Article Views (full-text article views including HTML views, PDF and ePub downloads, according to the available data) and Abstracts Views on Vision4Press platform.
Data correspond to usage on the plateform after 2015. The current usage metrics is available 48-96 hours after online publication and is updated daily on week days.
Initial download of the metrics may take a while.