Fig. 3
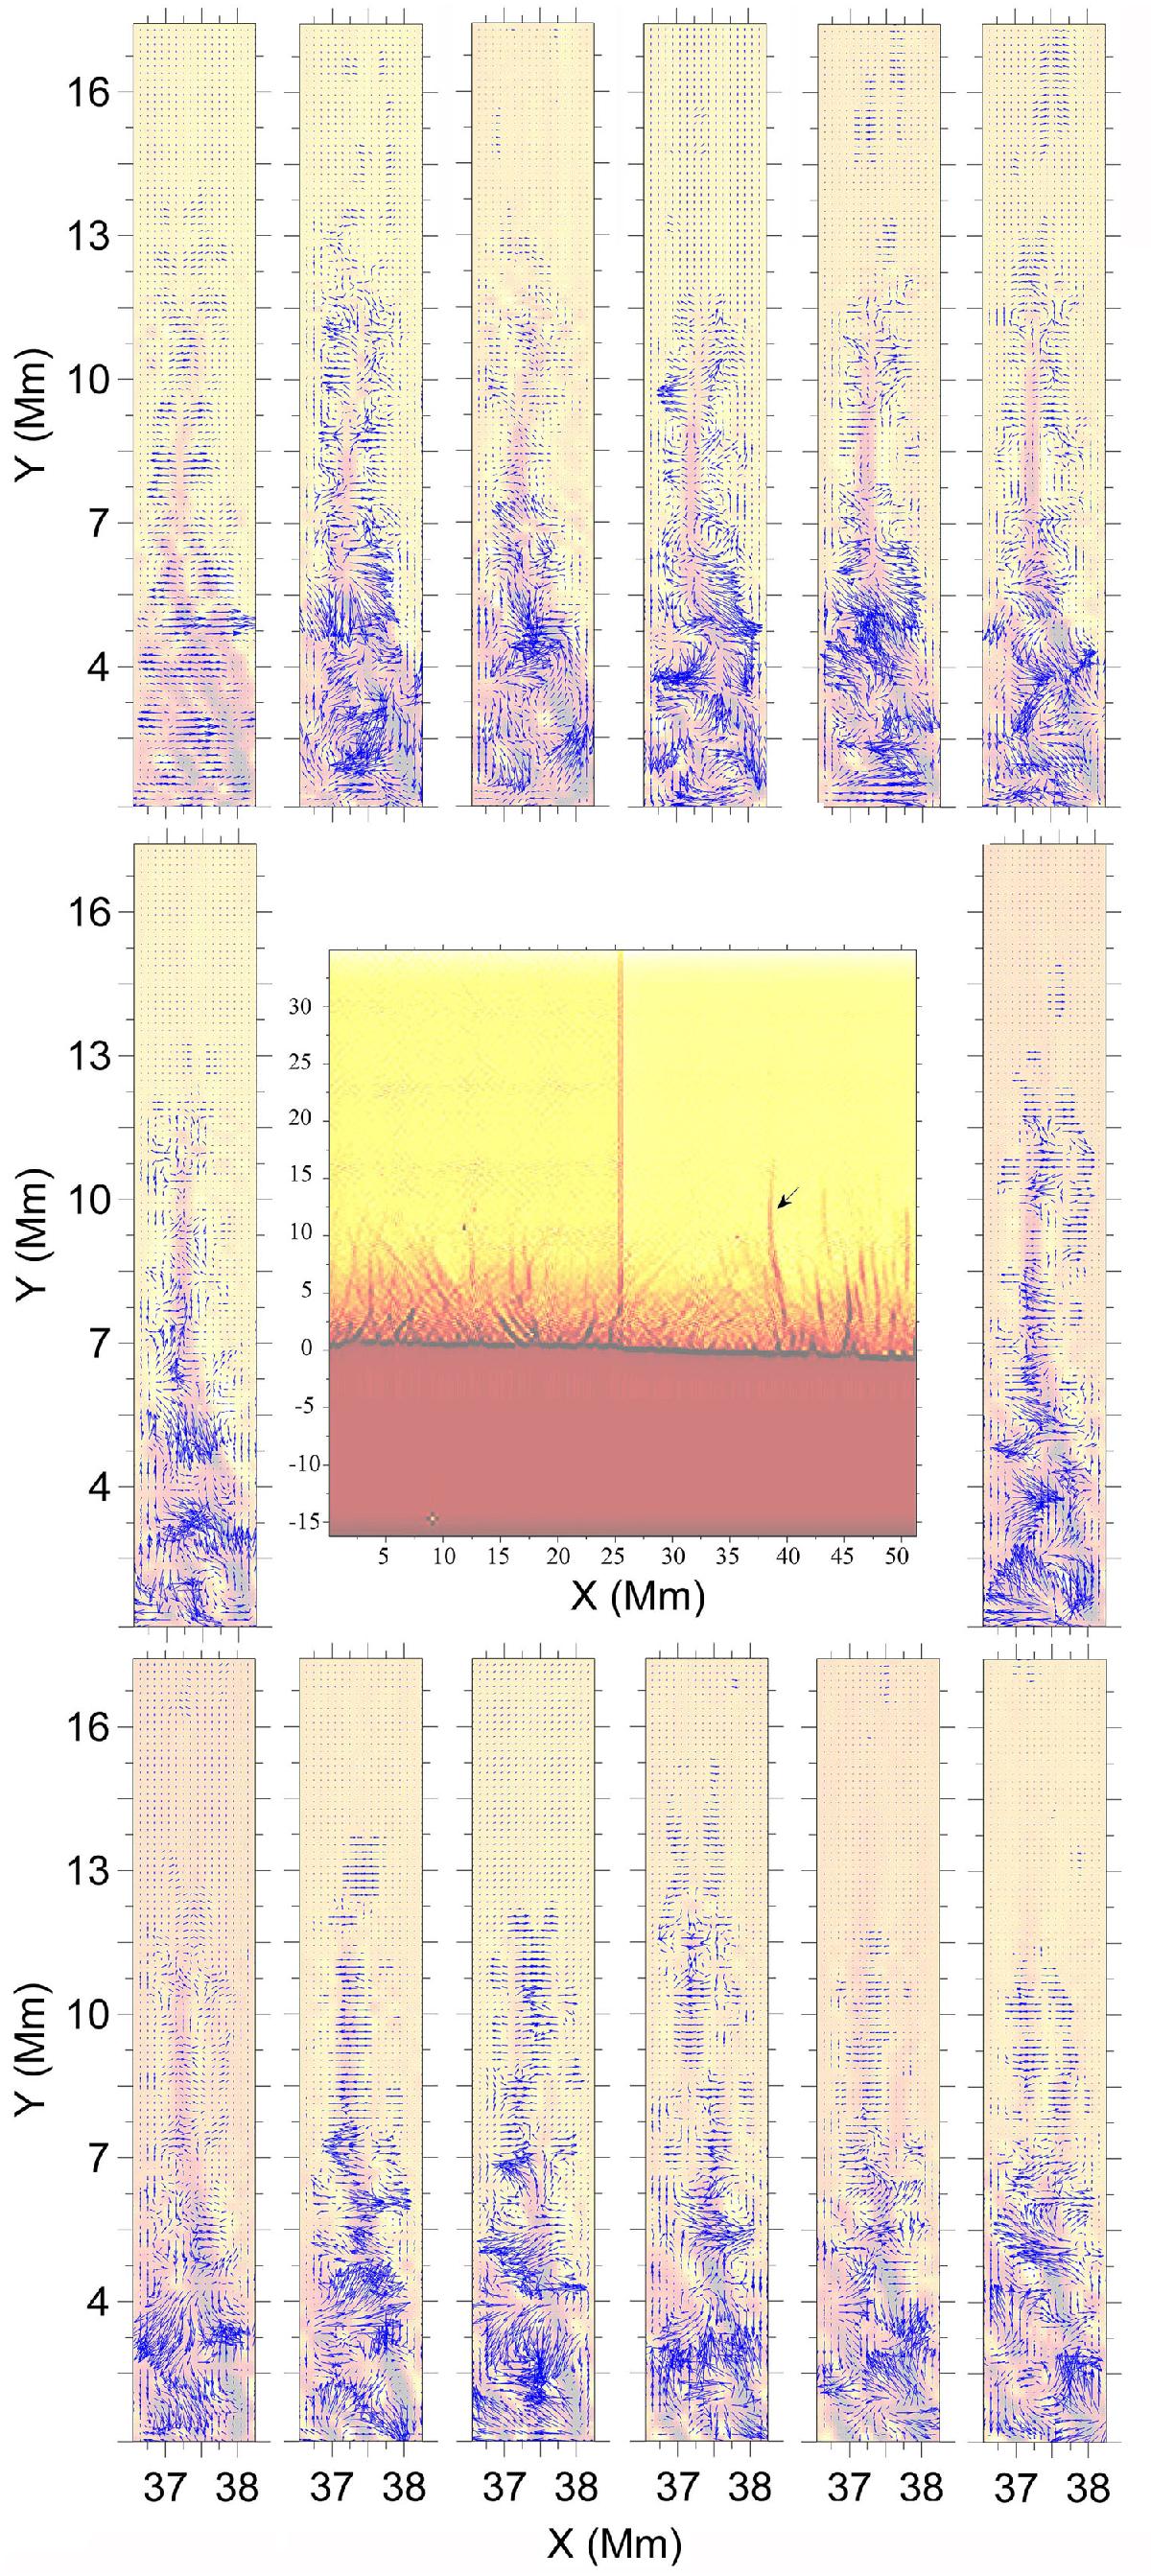
Example obtained using the FLCT algorithm for showing the 2D velocity maps from successive frames with a corresponding remarkable structure shown by the red arrow over a larger FOV shown in negative at the center. Spatial units used in the display are 0.1 arcsec (corresponds to pixel size), and the cadence is 1.6 s. Intensities in the proper motion maps are reproduced in red-orange. Note the large magnification needed to clearly evaluate the results (see in better reproduction in the electronic color version, to be magnified); see Fig. 4 for a quantitative evaluation of the amplitudes of velocities.
Current usage metrics show cumulative count of Article Views (full-text article views including HTML views, PDF and ePub downloads, according to the available data) and Abstracts Views on Vision4Press platform.
Data correspond to usage on the plateform after 2015. The current usage metrics is available 48-96 hours after online publication and is updated daily on week days.
Initial download of the metrics may take a while.