Fig. 1
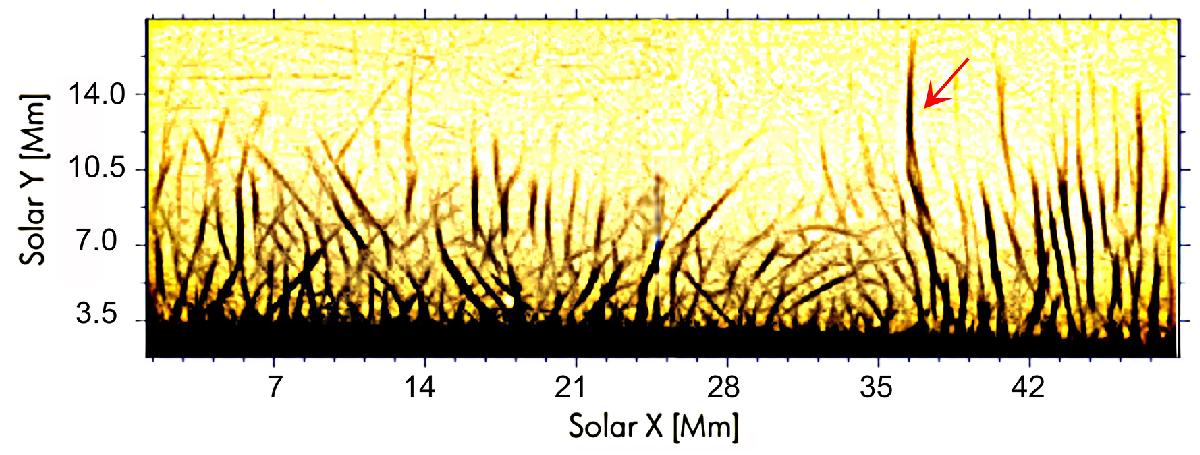
Example of an image processed by the mad-max algorithm. The image is based on a Hinode/SOT narrowband Ca II H image taken on 17 June 2011 at 9:13:42.4 UT. The color table is inverted to produce a negative image. The arrow points to the long twisted spicule and the loop structures next to it. A movie showing the temporal evolution is available online. (The spinning motions in the movie are most obvious when the movie is manually run at a higher speed than the default speed.)
Current usage metrics show cumulative count of Article Views (full-text article views including HTML views, PDF and ePub downloads, according to the available data) and Abstracts Views on Vision4Press platform.
Data correspond to usage on the plateform after 2015. The current usage metrics is available 48-96 hours after online publication and is updated daily on week days.
Initial download of the metrics may take a while.