| Issue |
A&A
Volume 572, December 2014
|
|
|---|---|---|
| Article Number | L8 | |
| Number of page(s) | 4 | |
| Section | Letters | |
| DOI | https://doi.org/10.1051/0004-6361/201425270 | |
| Published online | 03 December 2014 | |
Discovery of O vii line emitting gas in elliptical galaxies
1
Institute of Astronomy,
Madingley Road, CB3 0,
HA Cambridge,
UK
e-mail:
This email address is being protected from spambots. You need JavaScript enabled to view it.
2
Kavli Institute for Particle Astrophysics and Cosmology, Stanford
University, 452 Lomita
Mall, Stanford,
CA
94305-4085,
USA
3
Department of Physics, Stanford University,
382 via Pueblo Mall,
Stanford, CA
94305-4060,
USA
4
Department of Physics, University of Helsinki,
00014
Helsinki,
Finland
5
SRON Netherlands Institute for Space Research,
Sorbonnelaan 2, 3584 CA
Utrecht, The
Netherlands
6
Max-Planck-Institut fur extraterrestrische Physik,
Giessenbachstrasse 1,
85748
Garching,
Germany
7
Argelander-Institut für Astronomie, Universität
Bonn, Auf dem Hügel
71, 53121
Bonn,
Germany
Received: 4 November 2014
Accepted: 11 November 2014
Abstract
In the cores of ellipticals, clusters, and groups of galaxies, the gas has a cooling time shorter than 1 Gyr. It is possible to probe cooling flows through the detection of Fe xvii and O vii emission lines, but so far O vii has not been detected in any individual object. The Reflection Grating Spectrometers (RGS) aboard XMM-Newton are currently the only instruments able to detect O vii in extended objects such as elliptical galaxies and galaxy clusters. We searched for evidence of O vii through all the archival RGS observations of galaxy clusters, groups of galaxies, and elliptical galaxies focusing on those with core temperatures below 1 keV. We have discovered O vii resonance (21.6 Å) and forbidden (22.1 Å) lines for the first time in the spectra of individual objects. O vii was detected at a level higher than three sigma in six elliptical galaxies: M 84, M 86, M 89, NGC 1316, NGC 4636, and NGC 5846. M 84, M 86, and M 89 are members of the Virgo Cluster, the others are central dominant galaxies of groups, and most them show evidence of O vi in UV spectra. We detect no significant trend between the Fe xvii and O vii resonance-to-forbidden line ratios, possibly because of the limited statistics. The observed line ratios ⟨ Fer/f,Or/f ⟩ = (0.52 ± 0.02,0.9 ± 0.2) indicate that the spectra of all these ellipticals are affected by resonance scattering, suggesting low turbulence. Deeper exposures will help to understand whether the Fe xvii and O vii lines are both produced by the same cooling gas or by multiphase gas. Our O vii luminosities correspond to 0.2−2 M⊙ yr-1, which agree with the predictions for ellipticals. Such weak cooling rates would not be detected in clusters because their spectra are dominated by the emission of hotter gas, and owing to their greater distance, the expected O vii line flux would be undetectable.
Key words: galaxies: clusters: intracluster medium / X-rays: galaxies / X-rays: galaxies: clusters / galaxies: ISM / galaxies: abundances / galaxies: evolution
© ESO, 2014
1. Introduction
Most of the baryonic mass in clusters of galaxies is found in the form of hot 106−8 K gas, known as intracluster medium (ICM). The density of this gas strongly increases in the cores of the clusters where the radiative cooling time is less than 1 Gyr. In the absence of heating, this would imply that hundreds of solar masses per year cool below 106 K (Fabian 1994). At these temperatures, the gas is expected to produce prominent emission lines from O vi in UV, as well as O vii and Fe xvii in X-rays. O vi and O vii emissivities peak at 5 × 10⁵ K and 2 × 10⁶ K, respectively.
Weak cooling flows have been detected through the O vi UV lines by Bregman et al. (2005, 2006) at the levels of 30 M⊙ yr-1 or even lower (McDonald et al. 2014) compared to the predicted 102M⊙ yr-1. Fe xvii emission lines have been discovered, but no significant detections of O vii in any galaxy, cluster, or group of galaxies have been reported so far. Therefore there is a strong deficit of gas below 0.5 keV and much less cool gas than expected from cooling-flow models (see, e.g., Peterson et al. 2003). Recently, Sanders & Fabian (2011) have stacked 4.6 Ms of high-spectral-resolution XMM-Newton Reflection Grating Spectrometer (RGS) spectra from galaxy clusters, groups of galaxies, and elliptical galaxies. For those objects with a core temperature below 1 keV, they detected O vii emission for the first time, but they pointed out that the O vii/Fe xvii line flux ratio is at least one fourth of what is expected for isobaric radiative cooling. Therefore, there is either some heating process preventing cooling below 0.5 keV or absorbing material around the coolest X-ray emitting gas, or non-radiative cooling takes place (see, e.g., Sanders & Fabian 2011; and Werner et al. 2013).
The RGS instruments aboard XMM-Newton are currently the only high-resolution X-ray spectrometers able to detect and resolve the O vii and Fe xvii emission lines. We searched for evidence of O vii throughout all the archival XMM-Newton grating observations as published by 2014 August. We particularly focused on those objects that exhibit low-temperature (<1 keV) emitting gas (see, e.g., Su & Irwin 2013). We detected O vii in six objects at a level >3σ, but find some evidence of O vii in a total of nine elliptical galaxies. We benefited from excellent new data, in particular for NGC 5846, provided by the CHEERS project (see de Plaa et al. in prep. and Pinto et al. 2014).
This Letter summarizes our results. In Sect. 2 we present the data reduction. The spectral modeling is reported in Sect. 3. We discuss the results in Sect. 4 and give our conclusions in Sect. 5.
2. The data
The observations used in this paper are listed in Table 1. The XMM-Newton satellite is equipped with two types of X-ray detectors: the CCD type European Photon Imaging Cameras (EPIC) and the Reflection Grating Spectrometers (RGS). The RGS spectrometers are slitless, and the spectral lines are broadened by the source extent. We correct for spatial broadening through the use of EPIC/MOS 1 surface brightness profiles.
All the observations have been reduced with the XMM-Newton Science Analysis System (SAS) v13.5.0 using the latest calibration files. We correct for contamination from soft-proton flares following the XMM-SAS standard procedures.
For each source, we extracted the first-order RGS spectra in two cross-dispersion regions of 3.4′ and 0.8′ widths centered on the emission peak. These regions cover the bulk of the galaxy emission and the cores of the galaxies, respectively. We subtracted the model background spectrum, which is created by the standard RGS pipeline and is a template background file based on the count rate in CCD 9. For each source, we stacked the RGS spectra of all the observations with the rgscombine task and converted them to SPEX format through the SPEX task trafo. We extracted the MOS 1 images in the 8–27 Å wavelength band and obtained surface brightness profiles to model the RGS line spatial broadening (see e.g. de Plaa et al. 2012).
Our analysis focuses on the 8–27 Å first-order RGS spectra. The spectra are binned by a factor of 3, which provides the optimal spectral bin size of about 1/3 FWHM. We perform the spectral analysis with SPEX1 version 2.03.03 and scale elemental abundances to the proto-solar abundances of Lodders & Palme (2009). We use the updated ionization balance calculations of Bryans et al. (2009). C-statistics and 1σ errors are adopted.
XMM-Newton/RGS observations used in this paper.
XMM-Newton/RGS cooling flow modeling and O vii local fits.
3. Spectral modeling
We have modeled the RGS spectra with a cooling flow model (cflow), adopting a 0.1 keV minimum temperature. The cflow is corrected for the redshift and the Galactic absorption. The column densities are estimated through the tool of Willingale et al. (2013) to include contribution to absorption from both atomic and molecular hydrogen. The spectral model was broadened by the source extent through the lpro component that receives the MOS 1 spatial profile as input. For some sources we also added an absorbed, redshifted powerlaw to account for emission from the central point-like source. Free parameters in the fits are the cooling rate, the upper temperature, and the O/Fe, N/Fe, Ne/Fe, and Mg/Fe abundance ratios (Fe and other elements are assumed solar). We did not explicitly model the cosmic X-ray background in RGS because any diffuse emission feature would be smeared out into a broad continuum-like component.
The best-fit cooling rates, upper temperatures, and O/Fe abundance ratios are shown in Table 2. On average, the fits provide C-stat/d.o.f. = 540/400. We computed an equivalent  . Contrary to hotter groups and clusters of galaxies (see, e.g., Peterson et al. 2003), the cflow model describes the spectra of these cold systems very well. Their cooling rates are between 0.2 and 2 M⊙ yr-1, which are typically predicted for elliptical galaxies (see, e.g., Sarazin & Ashe 1989). Our values are generally larger than those measured by Bregman et al. (2005), except for IC 1459 and NGC 1316, most likely because FUSE has a smaller (30′′) aperture than our 50′′ and 200′′ regions. The disagreement between our Fe xvii–O vii and their O vi cooling rates may be due to the different assumptions made; for instance, they adopted solar abundances and the luminosities of one ion, O vi.
3.1. O VII detection level
To measure the significance of the O vii emission lines, we have removed the O vii ion from the model and fitted two delta lines fixed at 21.6 Å and 22.1 Å, which reproduce the O vii resonance and forbidden lines, respectively. The intercombination line at 21.8 Å generally appears to be insignificant and blends with the resonance line. These lines are corrected by the redshift, the Galactic absorption, and the spatial broadening, as in the cflow model. We tabulate the fluxes of these lines as measured in the 3.4′ and 0.8′ regions in Table 2. We quote the detection confidence levels for the regions with the highest significance for both O vii lines. We detected the O vii 21.6 Å resonance line at a ≳3σ level in five objects. The significance of the two lines was also combined by adding them in quadrature (see O viitot in Table 1). In order to have more robust results, we have fitted again the lines by fixing their flux ratio to (r/f) ≡ 1.3 as predicted by the thermal model (see O viisim in Table 1). The combination of the lines generally strengthen the significance and in particular provides ≳3σ for M 89.
We did the same exercise for the Fe xvii emission lines by removing the Fe xvii ion from the model and fitting four delta lines fixed at 15.01 Å, 15.26 Å, 16.78 Å, and 17.08 Å, which are the main Fe xvii transitions. We did not tabulate the significance of the Fe xvii lines because they are much stronger than the O vii lines with errors on average smaller by a factor ~5 (see Sect. 4). In Fig. 1 we show the final spectral fits with the specific modeling of the oxygen and the iron lines. The plots focus on the 14–24 Å wavelength range, which includes the relevant Fe xvii and O vii lines. The remaining emission lines are reproduced by the cooling-flow model.
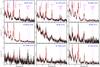 |
Fig. 1 XMM-Newton/RGS spectra with cooling flow models. O vii and Fe xvii are fitted separately. The O vii significance increases upward and the 22.1 Å/21.6 Å line ratio increases rightward. The extraction regions and the rest-frame wavelengths of the O vii lines are also indicated. |
3.2. Further tests
The continuum modeling may affect the O vii line fluxes. As for the test, we locally refit the 18–23 Å 3.4′ NGC 4636 and 5846 spectra. We still obtain >2.3σ detections for the 21.6 Å line in NGC 5846 and for both the lines in NGC 4636. NGC 1316–4636–5846 have multiple observations. We confirm the detection of O vii in the RGS 1 spectra of the two individual observations of NGC 1316 and in all the observations of NGC 4636 and NGC 5846 with exposure times above 40 ks.
An accurate background subtraction is crucial in this analysis. Our model background spectra are estimated from blank field observations and scaled by the count rate in CCD 9 (5–8 Å), where hardly any emission from each source is expected (see Sect. 2). Galaxies, groups and clusters of galaxies may still have significant emission in the 5–8 Å range. Our background subtraction may have been more severe than the necessary one, but this implies that our detection levels are conservative.
We also tested a different background for the 0.8′ and 3.4′ NGC 1316–4636–5846 spectra by selecting the standard region outside the 98% of the source counts. This background subtraction decreases the statistics in the 20–24 Å range because it includes part of the source emission, but we still detect the 21.6 Å line in each well-exposed RGS 1 spectrum of NGC 1316 and 5846. For NGC 4636 we only detect the 22.1 Å line.
4. Discussion
The previous detection of O vii in RGS stacked spectra of different sources and the FUSE/UV results on O vi in E-type galaxies motivated us to search for O vii in the high-resolution X-ray spectra of cool (≲1 keV) systems. We searched throughout all the RGS archive of clusters, groups, and elliptical galaxies. In this paper we have shown the results for those objects that show some evidence of O vii. This is the first time that O vii is significantly detected in a spectrum of an E-Type galaxy.
We detect the O vii (r) 21.6 Å line at a ≳3σ level in five objects: M 84, M 86, NGC 1316, NGC 4636, and NGC 5846. IC 1459, M 89, NGC 1332, and NGC 1404 show evidence of O vii but with lower significance. This is not surprising since they are typically fainter than the former five sources (see Fig. 1), or their observations have shorter exposure times (see Table 1). Deeper exposures should increase the significance of the detection and possibly unveil O vii in those sources whose exposures were too short to provide useful constraints. The combined 21.6 Å–22.1 Å significance is ≳3σ for M 89.
For some galaxies the O vii lines are only detected in one region. The 21.6 Å line is not significantly detected in the 0.8′ spectra of IC 1459, M 89, and NGC 1404, most likely because of the lower statistics in the narrow core. For the other five objects the (cool) 0.8′ core provides a higher significance presumably because the hotter lines like O viii have less of an impact on the statistics, and the counts of the O vii lines are still high. M 86 has a broader core than the eight other sources, which makes the lines broader and the detection more difficult. This is clearly seen in the 3.4′ spectrum where the lines are highly broadened, and it is not possible to resolve the 21.6 Å and 22.1 Å lines (see Fig. 1 and Table 2). We find a >2σ detection for all the sources showing O vi (Bregman et al. 2005, see also Table 2).
4.1. Evidence of resonant scattering
For some objects, in particular NGC 4636, the O vii 22.1 Å forbidden line appears to be stronger than the resonance line, though they would agree within the errors. In the absence of chaotic motions, the gas is optically thick in the resonant lines due to resonant scattering, while the forbidden lines remain optically thin. In the cores of NGC 4636 and 1404, the Fe xvii 15.0 Å line is strongly suppressed by resonant scattering as found by Werner et al. (2009). Their Fe xvii 15.0 Å/17.0 Å line ratios agree very well with our estimates.
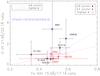 |
Fig. 2 O vii VS Fe xvii resonance-to-forbidden line ratios. The least-squares for the 0.8′ region and the combined 0.8′–3.4′ highest-σ points are shown (see also Table 2). The average (Fe, O) values are quoted. |
4.2. Origin of the O VII lines
We believe that the O vii lines are produced by diffuse gas in the galaxies and their groups for the following two reasons: 1) the lines are at their expected, rest-frame wavelengths, and they are too narrow to belong to either the local hot bubble or the Galactic gas; 2) they are broadened by the source extent exactly as the other lines (see Fig. 1), which means that the central point-like AGN would only make a small contribution.
It is more difficult to understand whether the Fe and O lines are produced by the same gas. We find that a single cooling flow model is able to fit the lines very well for all the objects.
We calculated the resonance-to-forbidden (r) / (f) line ratios of the O vii and Fe xvii lines as measured in the 0.8′ core and compared them in Fig. 2. If resonant scattering is occurring similarly for the 21.6 Å and the 15.0 Å lines, then we should find some correlation. The limited statistics of the O vii (r) / (f) line ratio does not allow us to put strong constraints. However, we find a weak correlation between the oxygen and iron line ratios, but their values agree with an average ⟨ Fer/f,Or/f ⟩ = (0.52 ± 0.02,0.9 ± 0.2). Deeper exposures will help to search for any clear trend in O–Fe (r) / (f) line ratios.
Interestingly, our optically thin plasma models predict Or/f> 1.1 and Fer/f> 0.7, depending slightly on the temperature. Our low values for Fer/f indicate that all these ellipticals are affected by resonant scattering. This would suggest low turbulence in these objects as found by Pinto et al. (2014).
It is not possible to detect ≲1 M⊙ yr-1 in cluster spectra because the corresponding emission lines would be hiding underneath the hot gas continuum. The 50–100 M⊙ yr-1 predicted rates are in principle detectable in RGS spectra of brightest cluster galaxies, but they have not been found. Dissipation of turbulence has recently been proposed as a mechanism that prevents cooling in clusters (see, e.g., Zhuravleva et al. 2014).
5. Conclusion
Cool core clusters and groups of galaxies and elliptical galaxies are thought to host gas with cooling times shorter than the Hubble time. Weak cooling flows have been found in the UV/FUSE O vi spectra of E-type galaxies. In the X-ray energy band, the Fe xvii and O vii emission lines are good tools for probing cooling gas. O vii has not been detected before in any individual object. We searched for O vii through all the XMM-Newton/RGS archive of galaxy clusters, groups of galaxies, and ellipticals.
We discovered O vii resonance (21.6 Å) and forbidden (22.1 Å) lines in a small sample of elliptical galaxies that are all contained in galaxy groups. A level higher than 3σ was measured in six galaxies: M 84, M 86, M 89, NGC 1316, NGC 4636, and NGC 5846. The O vii emission reveals cool diffuse gas in these galaxies and their groups. We could not find any significant trend between the Fe xvii and O vii resonance-to-forbidden line ratios because of the limited statistics. However, they agree well with ⟨ Fer/f,Or/f ⟩ = (0.52 ± 0.02,0.9 ± 0.2). These ratios indicate a significant suppression of the Fe xvii 15.0 Å resonance line and, possibly, of the O vii 21.6 Å resonance line as well by resonant scattering. This implies low gas turbulence. The weak ~1 M⊙ yr-1 cooling flows discovered in these elliptical galaxies and group of galaxies could not be significantly detected in clusters of galaxies because of the dominant hot continuum.
Acknowledgments
This work is based on observations of XMM-Newton, an ESA science mission funded by ESA Member States and the USA (NASA). Y.Y.Z. acknowledges the BMWi DLR grant 50 OR 1304.
References
- Bregman, J. N., Miller, E. D., Athey, A. E., & Irwin, J. A. 2005, ApJ, 635, 1031 [NASA ADS] [CrossRef] [Google Scholar]
- Bregman, J. N., Fabian, A. C., Miller, E. D., & Irwin, J. A. 2006, ApJ, 642, 746 [NASA ADS] [CrossRef] [Google Scholar]
- Bryans, P., Landi, E., & Savin, D. W. 2009, ApJ, 691, 1540 [NASA ADS] [CrossRef] [Google Scholar]
- de Plaa, J., Zhuravleva, I., Werner, N., et al. 2012, A&A, 539, A34 [NASA ADS] [CrossRef] [EDP Sciences] [Google Scholar]
- Fabian, A. C. 1994, ARA&A, 32, 277 [NASA ADS] [CrossRef] [Google Scholar]
- Lodders, K., & Palme, H. 2009, Meteoritics, 72, 5154 [Google Scholar]
- McDonald, M., Roediger, J., Veilleux, S., & Ehlert, S. 2014, ApJ, 791, L30 [NASA ADS] [CrossRef] [Google Scholar]
- Peterson, J. R., Kahn, S. M., Paerels, F. B. S., et al. 2003, ApJ, 590, 207 [NASA ADS] [CrossRef] [Google Scholar]
- Pinto, C., Sanders, J. S., Werner, N., et al. 2014, A&A, submitted [Google Scholar]
- Sanders, J. S., & Fabian, A. C. 2011, MNRAS, 412, L35 [NASA ADS] [CrossRef] [Google Scholar]
- Sarazin, C. L., & Ashe, G. A. 1989, ApJ, 345, 22 [NASA ADS] [CrossRef] [Google Scholar]
- Su, Y., & Irwin, J. A. 2013, ApJ, 766, 61 [NASA ADS] [CrossRef] [Google Scholar]
- Werner, N., Zhuravleva, I., Churazov, E., et al. 2009, MNRAS, 398, 23 [NASA ADS] [CrossRef] [Google Scholar]
- Werner, N., Oonk, J. B. R., Canning, R. E. A., et al. 2013, ApJ, 767, 153 [NASA ADS] [CrossRef] [Google Scholar]
- Willingale, R., Starling, R. L. C., Beardmore, A. P., Tanvir, N. R., & O’ Brien, P. T. 2013, MNRAS, 431, 394 [NASA ADS] [CrossRef] [Google Scholar]
- Zhuravleva, I., Churazov, E., Schekochihin, A. A., et al. 2014, Nature, 515, 85 [Google Scholar]
All Tables
All Figures
|
Fig. 1 XMM-Newton/RGS spectra with cooling flow models. O vii and Fe xvii are fitted separately. The O vii significance increases upward and the 22.1 Å/21.6 Å line ratio increases rightward. The extraction regions and the rest-frame wavelengths of the O vii lines are also indicated. |
| In the text | |
|
Fig. 2 O vii VS Fe xvii resonance-to-forbidden line ratios. The least-squares for the 0.8′ region and the combined 0.8′–3.4′ highest-σ points are shown (see also Table 2). The average (Fe, O) values are quoted. |
| In the text | |
Current usage metrics show cumulative count of Article Views (full-text article views including HTML views, PDF and ePub downloads, according to the available data) and Abstracts Views on Vision4Press platform.
Data correspond to usage on the plateform after 2015. The current usage metrics is available 48-96 hours after online publication and is updated daily on week days.
Initial download of the metrics may take a while.