Free Access
Fig. 2
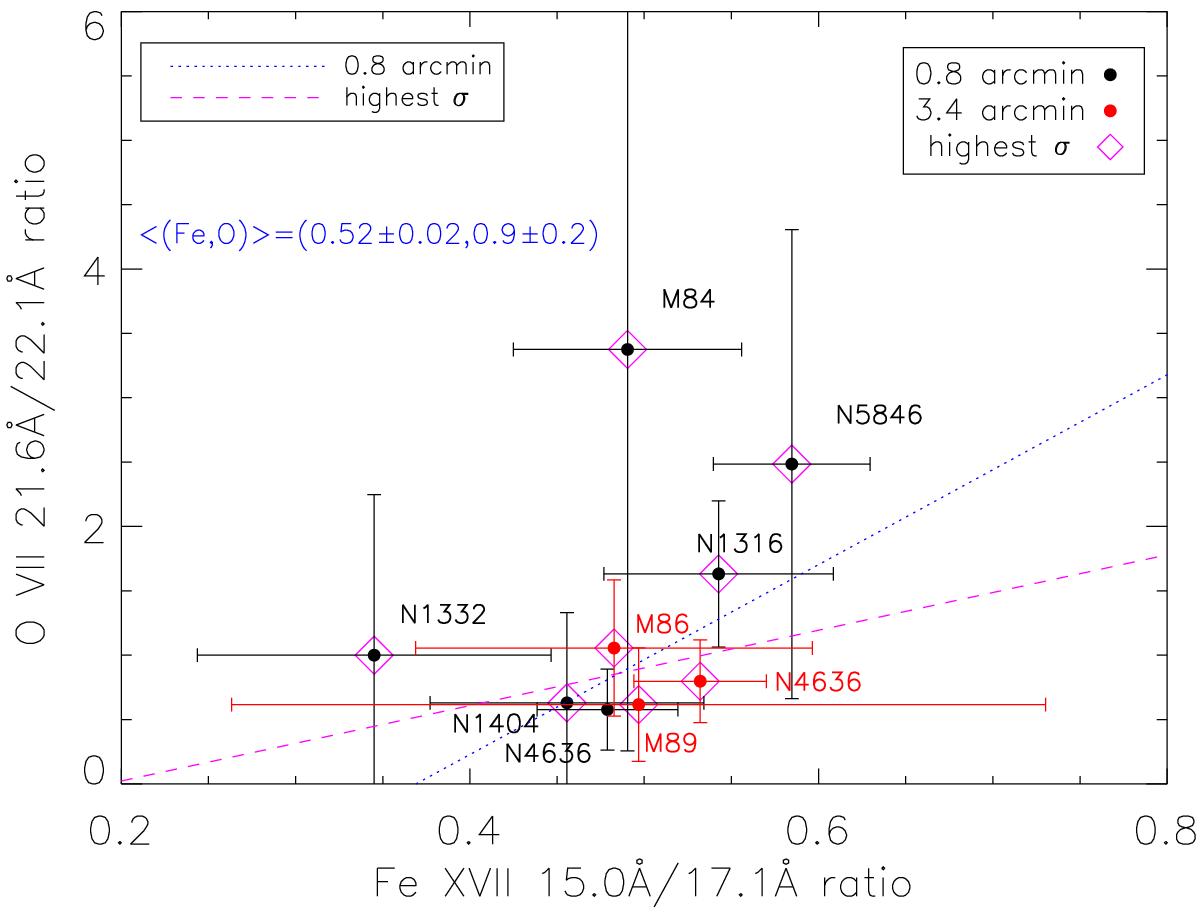
O vii VS Fe xvii resonance-to-forbidden line ratios. The least-squares for the 0.8′ region and the combined 0.8′–3.4′ highest-σ points are shown (see also Table 2). The average (Fe, O) values are quoted.
Current usage metrics show cumulative count of Article Views (full-text article views including HTML views, PDF and ePub downloads, according to the available data) and Abstracts Views on Vision4Press platform.
Data correspond to usage on the plateform after 2015. The current usage metrics is available 48-96 hours after online publication and is updated daily on week days.
Initial download of the metrics may take a while.