Fig. 2
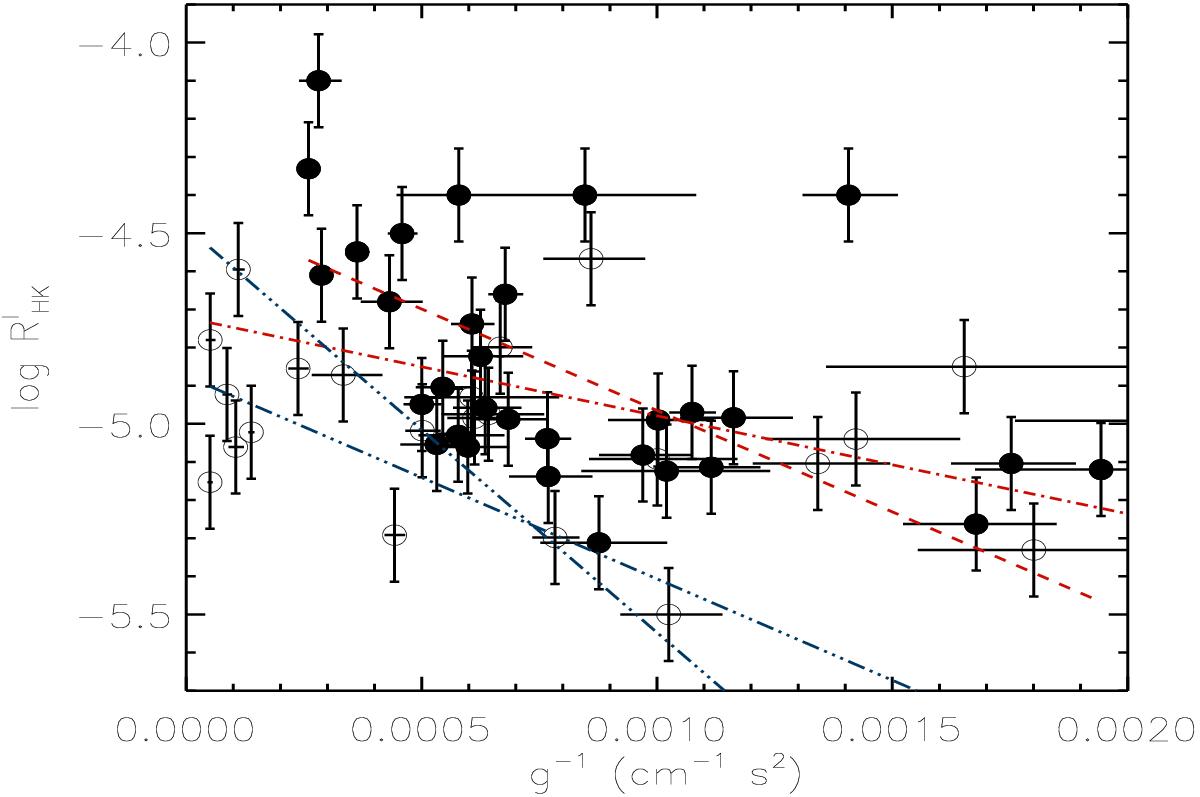
Chromospheric emission index ![]() vs. the inverse of the surface planetary gravity g for our sample of close-in planets. The red dashed line is a linear regression computed by considering the 31 data points (filled circles) with M> 0.1MJ, a< 0.1 AU and stellar effective temperature 4200 <Teff< 6200 K. The red dot-dashed line is a linear regression computed with the entire set of 54 data points. Those not included in the restricted sample are indicated by open circles. Note that the point corresponding to WASP-17b (an open circle) is outside the scale of the plot, but it is included in the regression. The three-dots-dashed blue lines are the theoretical relationship (6) for the Sun (the line with the lower slope) and for the illustrative case of a star with twice the solar chromospheric and FEUV fluxes.
vs. the inverse of the surface planetary gravity g for our sample of close-in planets. The red dashed line is a linear regression computed by considering the 31 data points (filled circles) with M> 0.1MJ, a< 0.1 AU and stellar effective temperature 4200 <Teff< 6200 K. The red dot-dashed line is a linear regression computed with the entire set of 54 data points. Those not included in the restricted sample are indicated by open circles. Note that the point corresponding to WASP-17b (an open circle) is outside the scale of the plot, but it is included in the regression. The three-dots-dashed blue lines are the theoretical relationship (6) for the Sun (the line with the lower slope) and for the illustrative case of a star with twice the solar chromospheric and FEUV fluxes.
Current usage metrics show cumulative count of Article Views (full-text article views including HTML views, PDF and ePub downloads, according to the available data) and Abstracts Views on Vision4Press platform.
Data correspond to usage on the plateform after 2015. The current usage metrics is available 48-96 hours after online publication and is updated daily on week days.
Initial download of the metrics may take a while.