| Issue |
A&A
Volume 572, December 2014
|
|
|---|---|---|
| Article Number | L3 | |
| Number of page(s) | 4 | |
| Section | Letters | |
| DOI | https://doi.org/10.1051/0004-6361/201424842 | |
| Published online | 24 November 2014 | |
Cosmic ray anisotropies near the heliopause
1 Centre for Space Research, North-West University, 2531 Rotchefstroom, South Africa
e-mail: This email address is being protected from spambots. You need JavaScript enabled to view it.
2 Institut für Theoretische Physik IV, Ruhr-Universität Bochum, 44780 Bochum, Germany
e-mail: This email address is being protected from spambots. You need JavaScript enabled to view it.
Received: 21 August 2014
Accepted: 21 October 2014
Abstract
Context. The Voyager 1 spacecraft became the first man-made probe to cross the heliopause into the local interstellar medium and measure the galactic environment, including charged particle intensities, in situ.
Aims. We qualitatively explain the observed anisotropies of galactic and anomalous cosmic rays in the interstellar medium.
Methods. A pitch-angle-dependent numerical model was constructed and applied to the study of both heliospheric (anomalous cosmic rays and termination shock particles) and galactic cosmic rays near the heliopause region.
Results. In accordance with the observations, the model is able to reproduce the observed anisotropic nature of both particle populations. In the interstellar medium, the heliospheric particle distribution shows a peak at pitch angles near 90°, while for galactic particles, their distribution shows a deficiency at these pitch-angle values.
Conclusions. The observed anisotropies are related to the pitch-angle dependence of the perpendicular diffusion coefficient, and if this dependence is chosen appropriately, the anisotropies observed by Voyager 1 can be explained naturally.
Key words: Sun: heliosphere / diffusion / cosmic rays
On sabbatical leave at the Institut für Theoretische Physik IV, Ruhr-Universität Bochum, Germany.
© ESO, 2014
1. Introduction
In August 2012, the Voyager 1 (V1) spacecraft encountered a new region of the heliosphere (Stone et al. 2013), referred to as the “heliocliff” (Fisk & Gloeckler 2013). Charged particle observations seemed to indicate that the heliopause (HP) was crossed, although the magnetic field observations did not exhibit the expected structure (Burlaga et al. 2013). Some authors have therefore postulated that V1 might still be inside the heliosphere (e.g. Schwadron & McComas 2013; Fisk & Gloeckler 2013), although the seemingly incongruous magnetic field measurements can readily be explained as indicative of the HP crossing (e.g. Opher & Drake 2013; Borovikov & Pogorelov 2014; Strumik et al. 2014). We subscribe to the more widely accepted view that, since August 2012, V1 has been sampling the local interstellar medium in situ, as appears to be confirmed by the plasma density observations by Gurnett et al. (2013).
The cosmic ray (CR) observations made during the HP crossing are generally of the expected form: CRs accelerated inside the heliosphere (referred to as heliospheric particles; consisting of the anomalous CRs and the so-called termination shock particles) show a marked decrease in intensity at the HP, while simultaneously, the intensity of CRs originating in interstellar space (galactic particles, consisting of the galactic CRs) increases (Stone et al. 2013). While the particle distributions are mostly isotropic inside the HP, the distributions beyond the HP show unexpected anisotropies with an excess of 90° pitch heliospheric particles and a depletion of 90° pitch galactic particles (Krimigis et al. 2013). While some authors (e.g. Florinski et al. 2013) have investigated possible explanations for the anisotropy of the heliospheric particle distribution, we believe that the anisotropic nature of both particle populations should be explained simultaneously by a single theory, and such a theory is put forward in this paper.
2. The transport model
To investigate the observed V1 anisotropies, we consider the following pitch-angle dependent transport equation (e.g. Skilling 1971)  (1)This equation describes the temporal evolution of the particle distribution function f(x,y,μ,t) (which is, for this specific scenario, proportional to the particle intensity) under the influence of the following processes (represented by the terms on the right-hand side): (i) streaming along the mean magnetic field with the parallel particle speed v|| = vμ, where the magnetic field is assumed to be directed along ŷ (B = Bŷ) and μ represents the cosine of the particle pitch-angle; (ii) diffusion in pitch-angle space; and (iii) diffusion perpendicular to B.
The model set-up used in this paper is illustrated schematically in Fig. 1: B is directed along ŷ, while the  -coordinate is perpendicular to B. The region where x< 0 (the shaded region in the figure) is characterized by a high value of Dμμ (more effective scattering in μ-space, hence, a relatively short parallel mean free path, λ||), while the region x> 0 is characterized by a much lower Dμμ (a much longer λ||). This set-up is, therefore, representative of a thin region near the HP. The HP is located at x = 0 and forms a tangential discontinuity separating the regions of different scattering, with x< 0 identifying regions inside the heliosphere (inner heliosheath) and x> 0 representing interstellar space (outer heliosheath).
2.1. The pitch-angle diffusion coefficient
The adopted radial dependence of Dμμ is shown in the top panel of Fig. 2 and identifies the two distinct regions discussed previously. The bottom panel of the figure illustrates the μ-dependence of Dμμ as taken from, for example, Dröge et al. (2010), which results from the quasi-linear theory (QLT, Jokipii 1966) of pitch-angle scattering but also includes non-linear effects in an ad-hoc fashion. Using our choices of Dμμ, with v = 1 AU h-1 assumed, and calculating λ|| (e.g. Hasselmann & Wibberenz 1968), we find λ|| ≈ 1 AU for the inner heliosheath and λ|| ≈ 1000 AU for the outer heliosheath.
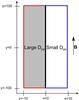 |
Fig. 1 Schematic representation of the computational domain used in this study. The direction of the assumed magnetic field is indicated by B, while the HP is located at x = 0, separating heliospheric (the shaded region where x< 0) and interstellar (where x> 0) regions, i.e. separating the inner and outer heliosheath. In this simulation, heliospheric particles originate at all red coloured boundaries, while blue boundaries indicate the source of galactic particles. The length unit is 1 AU. |
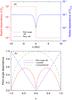 |
Fig. 2 Top panel: the radial dependencies of Dμμ (dashed red line; left axis) and D⊥ (solid blue line; right axis) in arbitrary units. Bottom panel: the μ-dependencies of Dμμ (solid red line), v|| (dashed blue line), and v⊥ (dash-dotted green line). |
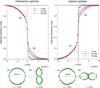 |
Fig. 3 Top panels: the intensity for heliospheric (left panel) and galactic (right panel) particles for three different choices of the pitch angle along a cut perpendicular to the HP. The four bottom panels show the distribution of heliospheric (panels a) and b)) and galactic (panels c) and d)) particles as a function of pitch angle at x = −2 AU (panels a) and c)) and x = 2 AU (panels b) and d)), with the arrow indicating the orientation of B. The normalized pitch-angle distributions are scaled differently in each panel, as indicated. |
2.2. The perpendicular diffusion coefficient
The spatial dependence of D⊥ is also shown in the top panel of Fig. 2. The value of D⊥ is decreased near the HP to account for the possibility of reduced perpendicular transport in this region (Florinski et al. 2013; Quenby & Webber 2013). While this reduction (or its absence) does not affect the principle results presented here, the μ-dependence of D⊥ is, however, very important because it determines which particles may cross the HP more favourably. Florinski et al. (2013), for instance, used the field-line random walk (FLRW) limit of QLT (Jokipii 1972) to determine D⊥(μ), leading to (see also Dosch & Shalchi 2009; Qin & Shalchi 2014)  (2)However, we examine the effect of instead adopting a form of D⊥ that has a maximum at μ = 0
 (3)The dependence on v⊥ was chosen seemingly arbitrarily, but motivated by the extensive and successful use of this functional form by, for instance, Dröge et al. (2010) and Dresing et al. (2012) in modelling solar energetic particle transport at the pitch-angle level. Moreover, Burlaga & Ness (2012) report that the turbulence conditions in the heliosheath are drastically different from those in the supersonic solar wind. This may cause “traditional” diffusion coefficients, such as the FLRW coefficient, to become inaccurate close to the HP. Beyond the HP, it is expected that the particle gyro-radius (a least for the energies considered here) is much shorter than the turbulence correlation length. For such a scenario, the perpendicular diffusion theory of Fraschetti & Jokipii (2011) may be applied, where the “total” diffusion coefficient is the sum of the standard FLRW coefficient and a term due to the drift motion in a slowly varying turbulent background magnetic field, D⊥ = DFLRW + Ddrift, where
  (4)and V is the transverse guiding centre drift velocity. We expect the FLRW coefficient to be damped at the HP (a discussion follows later in this letter; Florinski et al. 2013), so that D⊥ ≈ Ddrift. Moreover, when gradient drifts are considered, V ~ v⊥, so that we expect that D⊥ ~ 1 − μ2, vindicating our use of Eq. (3), or any equivalent form that obtains its maximum at μ = 0, for use in qualitative modelling studies.
It should be noted that when we study the transport of particles with smaller scales than the turbulence injection scale (may be the case in the interstellar medium for low energy particles), the perpendicular diffusion process can become superdiffusive (e.g. Xu & Yan 2013; Lazarian & Yan 2014). For this scenario, a more general transport model would be needed (Stern et al. 2014), but such an implementation falls beyond the scope of this work.
In this work, Eq. (1) is solved using a numerical scheme based on stochastic differential equations (SDEs; Strauss et al. see e.g. 2011, and references therein) in a time backward fashion. An isotropic distribution of heliospheric particles is specified at all computational boundaries for which x< 0 (Fig. 1), while galactic particles are specified at all boundaries with x> 0.
3. Results
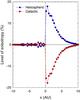 |
Fig. 4 Calculated level of anisotropy for galactic (red circles) and heliospheric (blue squares) particles as a function of position along y = 0. The HP is once again located at x = 0. |
In this paper we aim to explain the observed V1 anisotropies qualitatively and do not attempt to fit observations. This will be done in future publications when we have a better understanding of the transport parameters in this previously unexplored region.
Figure 3 summarizes the results of the transport model outlined in the previous section. Here, the intensity is shown for heliospheric (left panels) and galactic (right panels) particles as a function of x (distance away from the HP) at y = 0. Results are shown for pitch angles of 5° (dash-dotted line, triangles), 45° (dashed line, circles), and 90° (solid line, squares). Inside the heliosphere in the inner heliosheath (i.e. x< 0), the intensities are similar for all pitch angles. This is expected because of the efficient particle scattering in this region leading to an isotropization of the distribution function regardless of the pitch-angle dependence of the transport parameters assumed. Sub-panels a and c illustrate the isotropic nature of the distribution function at x = −2 AU for heliospheric (panel a) and galactic (panel c) particles. These panels are in the form of polar plots, giving the intensity as a function of pitch angle (relative to B, indicated by the arrow).
In the interstellar medium (i.e. x> 0), i.e. the outer heliosheath, anisotropies are possible because of the low value of Dμμ, such that these anisotropies (at least for the model described here) are governed by the μ-dependence of D⊥. For heliospheric particles, those with 90° pitch can cross the HP (diffusively) most efficiently into the interstellar medium. As a result, there is an excess of these particles at x> 0. Sub-panel b shows the distribution of heliospheric particles (at x = 2 AU) in the interstellar medium peaking at 90°. For galactic particles, those with 90° pitch are the most efficient at entering the heliosphere (i.e. escaping the interstellar regions), which leads to a deficiency of 90° pitch galactic particles in the outer heliosheath, and indeed, sub-panel d shows the distribution of galactic particles (at x = 2 AU) exhibiting a clear a minimum at 90° pitch angles.
In an attempt to quantify the level of anisotropy and, more importantly, the spatial dependence thereof, we calculate A(x) = {f90(x) − f5(x)} × 100% for both galactic and heliospheric particles, where f90 and f5 are the (already normalized) intensities at pitch angles of 90° and 5°, respectively. The results of this calculation are presented in Fig. 4. Inside the heliosphere, A ~ 0, again illustrating the isotropic nature of the distribution function, whereas A ≠ 0 in the interstellar medium. As already mentioned, in this region, A> 0 for heliopheric particles (an excess of 90° pitch particles), while A< 0 for galactic particles. Both particle populations reach A → 0 as x → 10 AU; for the heliospheric particles, this happens because their intensities become zero. An interesting result is that for galactic particles in particular, the maximum level of anisotropy is not reached directly at the HP, but at some (parameter-dependent) distance beyond the HP in the interstellar medium. This is also evident in the Voyager observations, where Krimigis et al. (2013) shows an increasing level of anisotropy beyond the HP that becomes negligible later on. (This part of the observations has yet to be published.)
4. Discussion
In this paper, we have presented a qualitative explanation for the anisotropic particle intensities observed by V1 in the vicinity of the HP. In accordance with these observations, we find that:
-
the distribution of both heliospheric and galactic particles areisotropic within the heliosphere;
-
the distribution of both particle populations can become (highly) anisotropic beyond the HP;
-
the anisotropy in the interstellar medium is such that there is an excess of 90° pitch heliospheric particles and a deficiency of 90° pitch galactic particles.
These results follow readily from a fairly basic pitch-angle dependent transport model that relies on the assumptions that:
-
the scattering rate Dμμ must be high inside the heliosphere and lowbeyond the HP;
-
the functional form of D⊥ must be such that it obtains its maximal value at μ = 0, i.e. at 90° pitch.
We believe that these two assumptions are very reasonable and lead to a natural explanation for the recent V1 particle observations. The adopted form of D⊥ is perhaps the most speculative assumption made here, but with our current, very limited,
knowledge of particle scattering and the underlying turbulence in the heliosheath and beyond (Burlaga et al. 2014), we believe that this adopted form is, at least, plausible and as such, should be investigated in detail.
An outstanding topic of study, possibly related to the work presented here, but not discussed in great detail, is the extent to which perpendicular diffusion may be suppressed at the HP. In this work, the magnitude of D⊥, which is related to the isotropic perpendicular diffusion coefficient κ⊥ (e.g. Schlickeiser 2002), was reduced directly at the HP. Without this reduction, the results presented in Fig. 3 remain similar, although the particle gradients at the HP become smaller, so that the decrease (or increase) in intensity occurs over a much longer distance. The sharpness of this transition, as observed by V1, therefore suggests a suppression of D⊥ (see also Florinski et al. 2013). The magnitude and even the presence of this suppression is still not understood. It is also unclear how this reduction of κ⊥ (and the corresponding perpendicular mean free path, λ⊥), if indeed present, will affect the possibility of galactic CR modulation occurring beyond the HP. Strauss et al. (2013) showed that modulation of galactic CRs in this region is largely dependent on the ratio λ⊥/λ||, and a suppression of λ⊥ may thus damp the modulation effects directly beyond the HP.
Acknowledgments
R.D.S. acknowledges the partial financial support of the South African National Research Foundation (NRF). H.F. acknowledges support via the project FI 706/15 funded by the Deutsche Forschungsgemeinschaft (DFG). This research was partially funded by the Alexander von Humboldt Foundation. The work also benefited from discussions at the team meeting “Heliosheath Processes and Structure of the Heliopause: Modelling Energetic Particles, Cosmic Rays and Magnetic Fields”, supported by the International Space Science Institute (ISSI) in Bern, Switzerland.
References
- Borovikov, S. N., & Pogorelov, N. V. 2014, ApJ, 783, L16 [NASA ADS] [CrossRef] [Google Scholar]
- Burlaga, L. F., & Ness, N. F. 2012, ApJ, 744, 51 [NASA ADS] [CrossRef] [Google Scholar]
- Burlaga, L. F., Ness, N. F., & Stone, E. C. 2013, Science, 341, 147 [NASA ADS] [CrossRef] [Google Scholar]
- Burlaga, F., Ness, N. F., Florinski, V., et al. 2014, ApJ, 792, 134 [NASA ADS] [CrossRef] [Google Scholar]
- Dosch, A., & Shalchi, A. 2009, MNRAS, 394, 2089 [NASA ADS] [CrossRef] [Google Scholar]
- Dresing, N., Gómez-Herrero, R., Klassen, A., et al. 2012, Sol. Phys., 281, 281 [NASA ADS] [Google Scholar]
- Dröge, W., Kartavykh, Y. Y., Klecker, B., et al. 2010, ApJ, 709, 912 [NASA ADS] [CrossRef] [Google Scholar]
- Fisk, L. A., & Gloeckler, G. 2013, ApJ, 776, 79 [NASA ADS] [CrossRef] [Google Scholar]
- Florinski, V., Alouani-Bibi, F., Kota, J., et al. 2012, ApJ, 754, 31 [NASA ADS] [CrossRef] [Google Scholar]
- Florinski, V., Jokipii, J. R., Alouani-Bibi, F., et al. 2013, ApJ, 776, L37 [NASA ADS] [CrossRef] [Google Scholar]
- Fraschetti, F., & Jokipii, J. R. 2011, ApJ, 734, 83 [CrossRef] [Google Scholar]
- Gurnett, D. A., Kurth, W. S., Burlaga, L. F., et al. 2013, Science, 341, 1489 [NASA ADS] [CrossRef] [Google Scholar]
- Hasselmann, K., & Wibberenz, G. 1968, Z. Geophys., 34, 353 [Google Scholar]
- Jokipii, J. R. 1966, ApJ, 146, 480 [Google Scholar]
- Jokipii, J. R. 1972, ApJ, 172, 319 [NASA ADS] [CrossRef] [Google Scholar]
- Krimigis, S. M., Decker, R. B., Roelof, E. C., et al. 2013, Science, 341, 144 [NASA ADS] [CrossRef] [PubMed] [Google Scholar]
- Lazarian, A., & Yan, H. 2014, ApJ, 784, 38 [NASA ADS] [CrossRef] [Google Scholar]
- Opher, M., & Drake, J. F. 2013, ApJ, 778, L26 [NASA ADS] [CrossRef] [Google Scholar]
- Qin, G., & Shalchi, A. 2009, ApJ, 707, 61 [NASA ADS] [CrossRef] [Google Scholar]
- Qin, G., & Shalchi, A. 2014, App. Phys. Res., 6, 1 [Google Scholar]
- Quenby, J. J., & Webber, W. R. 2013, MNRAS, 436, 3306 [NASA ADS] [CrossRef] [Google Scholar]
- Schwadron, N. A., & McComas, D. J. 2013, ApJ, 778, L33 [NASA ADS] [CrossRef] [Google Scholar]
- Shalchi, A., & Schlickeiser, R. 2004, A&A, 420, 821 [NASA ADS] [CrossRef] [EDP Sciences] [Google Scholar]
- Schlickeiser, R. 2002, Cosmic Ray Astrophysics (Berlin: Springer-Verlag) [Google Scholar]
- Skilling, J. 1971, ApJ, 170, 265 [NASA ADS] [CrossRef] [Google Scholar]
- Stern, R., Effenberger, F., et al. 2014, Fract. Calc. Appl. Anal., 17, 171 [CrossRef] [Google Scholar]
- Stone, E. C., Cummings, A. C., McDonald, F. B., et al. 2013, Science, 341, 150 [NASA ADS] [CrossRef] [PubMed] [Google Scholar]
- Strauss, R. D., Potgieter, M. S., Büsching, I., et al. 2011, ApJ, 735, 83 [NASA ADS] [CrossRef] [Google Scholar]
- Strauss, R. D., Potgieter, M. S., Ferreira, S. E. S., et al. 2013, ApJ, 765, L18 [NASA ADS] [CrossRef] [Google Scholar]
- Strumik, M., Grzedzielski, S., Czechowski, A., et al. 2014, ApJ, 782, L7 [NASA ADS] [CrossRef] [Google Scholar]
- Xu, A., & Yan, H. 2013, ApJ, 779, 140 [NASA ADS] [CrossRef] [Google Scholar]
All Figures
|
Fig. 1 Schematic representation of the computational domain used in this study. The direction of the assumed magnetic field is indicated by B, while the HP is located at x = 0, separating heliospheric (the shaded region where x< 0) and interstellar (where x> 0) regions, i.e. separating the inner and outer heliosheath. In this simulation, heliospheric particles originate at all red coloured boundaries, while blue boundaries indicate the source of galactic particles. The length unit is 1 AU. |
| In the text | |
|
Fig. 2 Top panel: the radial dependencies of Dμμ (dashed red line; left axis) and D⊥ (solid blue line; right axis) in arbitrary units. Bottom panel: the μ-dependencies of Dμμ (solid red line), v|| (dashed blue line), and v⊥ (dash-dotted green line). |
| In the text | |
|
Fig. 3 Top panels: the intensity for heliospheric (left panel) and galactic (right panel) particles for three different choices of the pitch angle along a cut perpendicular to the HP. The four bottom panels show the distribution of heliospheric (panels a) and b)) and galactic (panels c) and d)) particles as a function of pitch angle at x = −2 AU (panels a) and c)) and x = 2 AU (panels b) and d)), with the arrow indicating the orientation of B. The normalized pitch-angle distributions are scaled differently in each panel, as indicated. |
| In the text | |
|
Fig. 4 Calculated level of anisotropy for galactic (red circles) and heliospheric (blue squares) particles as a function of position along y = 0. The HP is once again located at x = 0. |
| In the text | |
Current usage metrics show cumulative count of Article Views (full-text article views including HTML views, PDF and ePub downloads, according to the available data) and Abstracts Views on Vision4Press platform.
Data correspond to usage on the plateform after 2015. The current usage metrics is available 48-96 hours after online publication and is updated daily on week days.
Initial download of the metrics may take a while.