Fig. 3
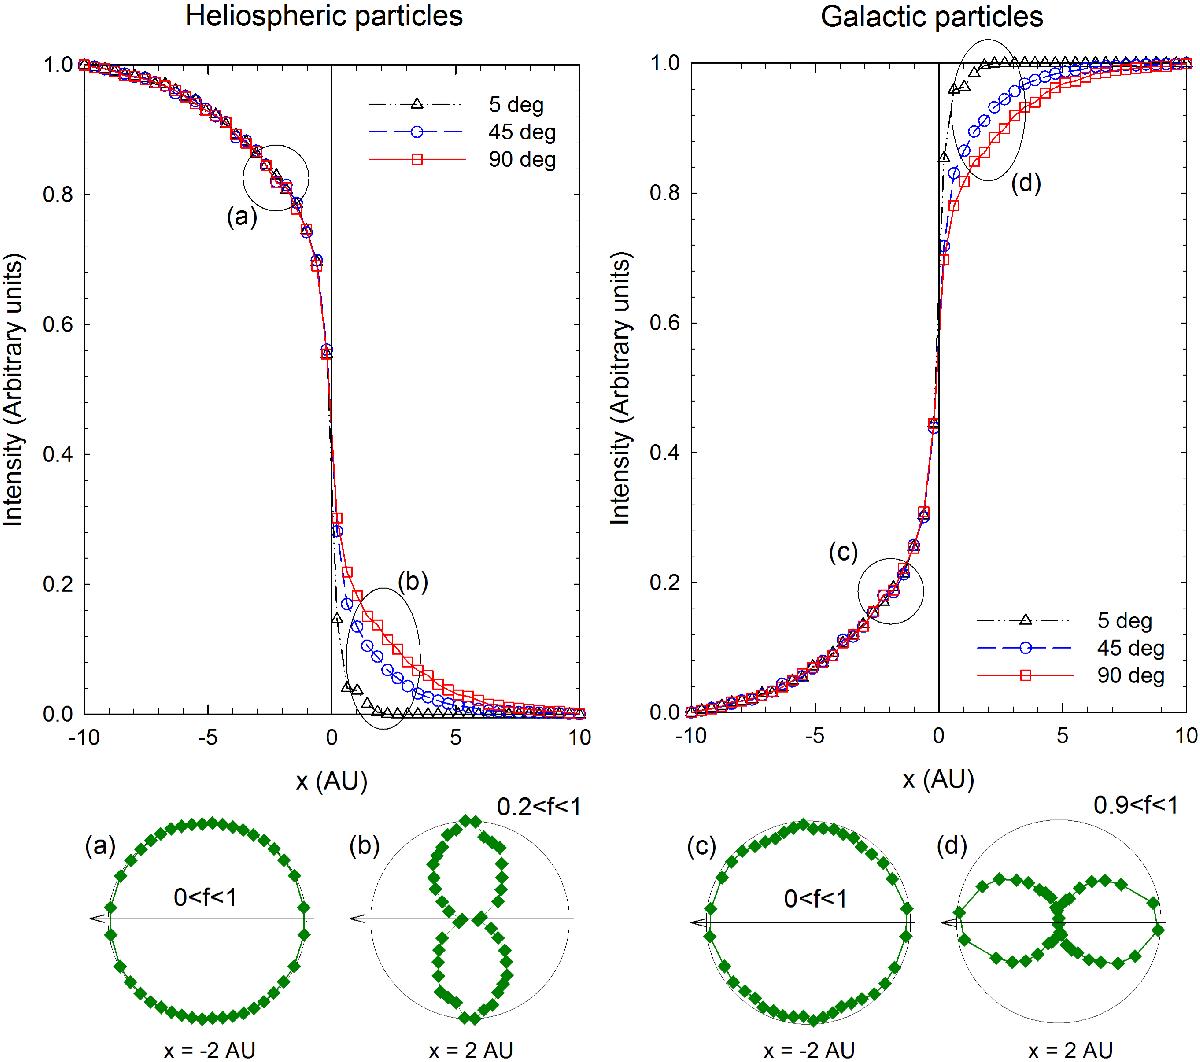
Top panels: the intensity for heliospheric (left panel) and galactic (right panel) particles for three different choices of the pitch angle along a cut perpendicular to the HP. The four bottom panels show the distribution of heliospheric (panels a) and b)) and galactic (panels c) and d)) particles as a function of pitch angle at x = −2 AU (panels a) and c)) and x = 2 AU (panels b) and d)), with the arrow indicating the orientation of B. The normalized pitch-angle distributions are scaled differently in each panel, as indicated.
Current usage metrics show cumulative count of Article Views (full-text article views including HTML views, PDF and ePub downloads, according to the available data) and Abstracts Views on Vision4Press platform.
Data correspond to usage on the plateform after 2015. The current usage metrics is available 48-96 hours after online publication and is updated daily on week days.
Initial download of the metrics may take a while.