Fig. 7
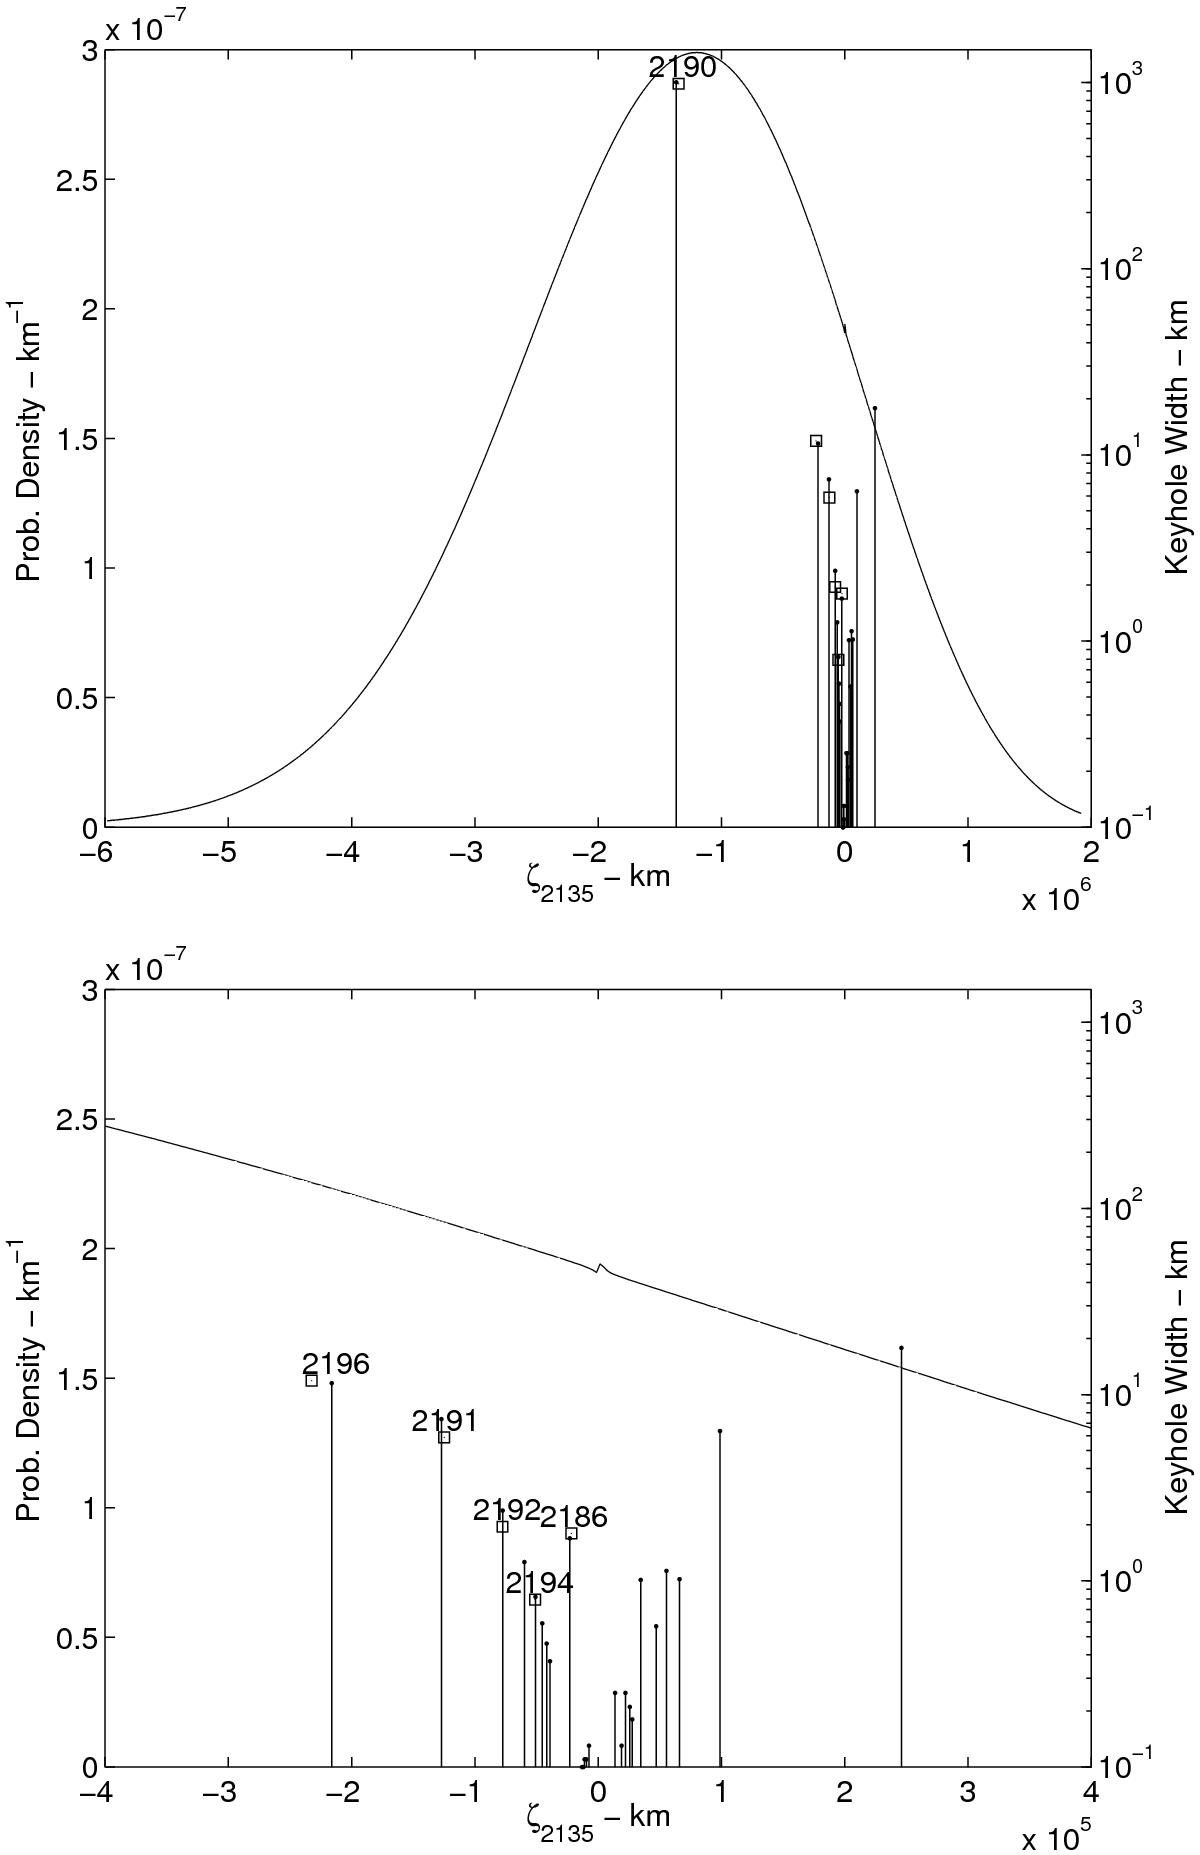
Map of the 2009 FD impact keyholes intersecting the trace of the LOV on the 2185 TP, computed both numerically and analitically. The probability density is given by the curve with the left scale, and the analytically computed keyholes are indicated by the vertical lines with their widths given by the height of the bar (right scale). The 7 actual VIs found numerically (from Table 2) are marked with a square.
Current usage metrics show cumulative count of Article Views (full-text article views including HTML views, PDF and ePub downloads, according to the available data) and Abstracts Views on Vision4Press platform.
Data correspond to usage on the plateform after 2015. The current usage metrics is available 48-96 hours after online publication and is updated daily on week days.
Initial download of the metrics may take a while.