Fig. 5
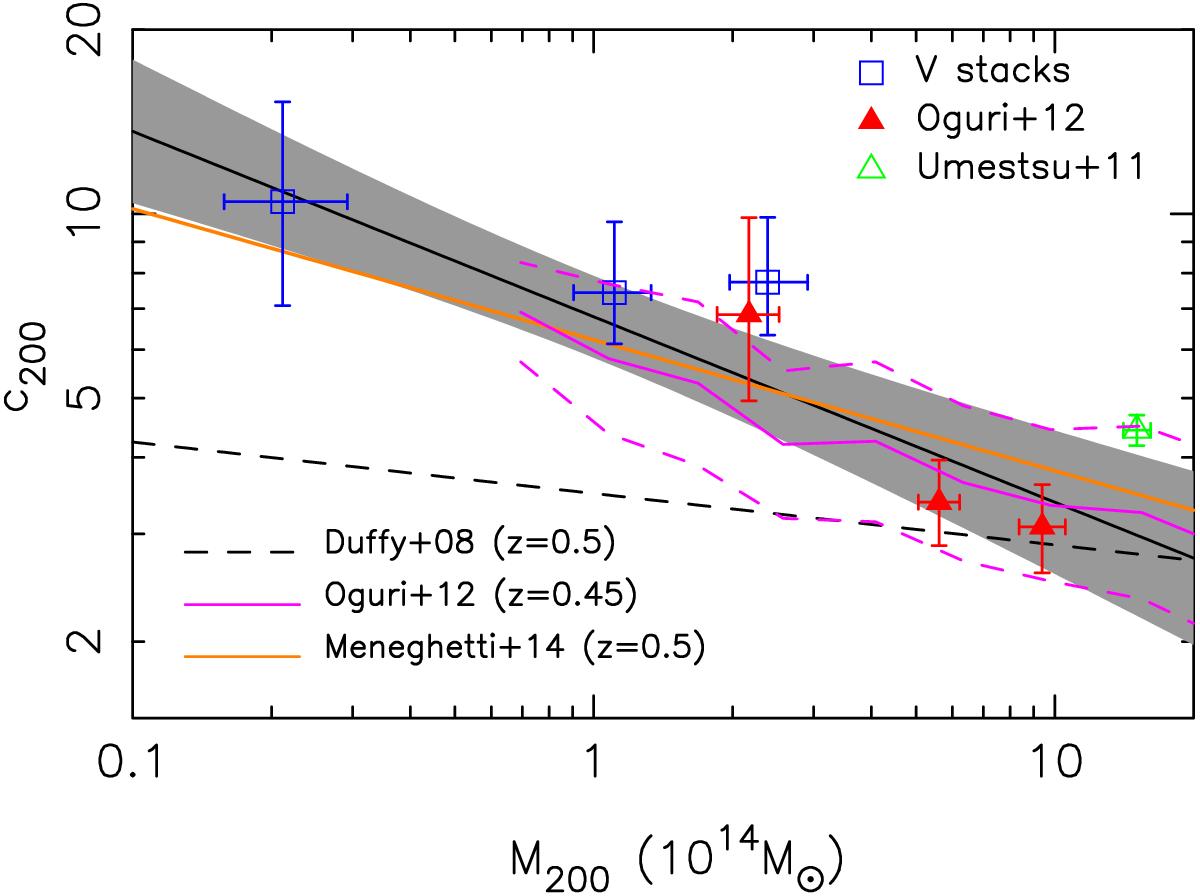
Combined fit of the mass-concentration relation, using the results from the stacks in velocity dispersion (open-blue squares, weak-lensing alone) and the values derived by Oguri et al. (2012; red triangles) and Umetsu et al. (2011a; open-green triangle) from the stacked analysis of strong-lensing galaxy clusters. The best-fit relation was obtained assuming a scaling in redshift of (1 + z)-0.45, and the black solid line show the results for z = 0.5 (the gray-shaded area delimits the statistical uncertainty from the best-fit parameters). Overplotted are the relations derived from numerical simulations by Duffy et al. (2008; black-dashed line, all haloes, z = 0.5) and Meneghetti et al. (2014; orange-solid line, strong-lensing selected haloes, z = 0.5). The magenta-dashed lines show the 1σ limit around the average relation derived by Oguri et al. (2012) from semi-analytical predictions (lensing bias using weights from the arc cross section+Einstein radii, z = 0.45).
Current usage metrics show cumulative count of Article Views (full-text article views including HTML views, PDF and ePub downloads, according to the available data) and Abstracts Views on Vision4Press platform.
Data correspond to usage on the plateform after 2015. The current usage metrics is available 48-96 hours after online publication and is updated daily on week days.
Initial download of the metrics may take a while.