Fig. 3
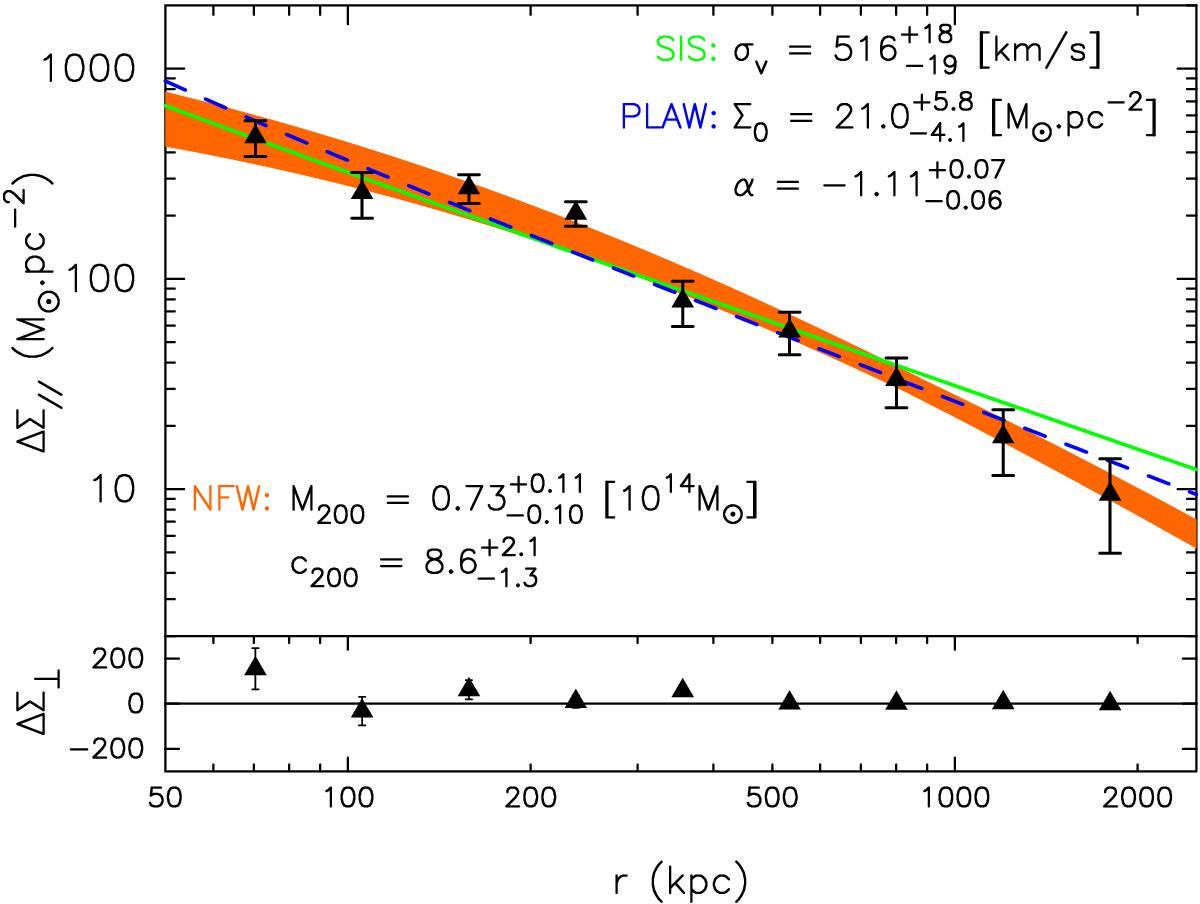
Average density contrast ΔΣ(r) for the stack S0 (Eq. (5)). The lower panel shows the profile obtained using the radial component of the lensed galaxies’ ellipticity, and should be equals to zero. The upper panel is the profile using the tangential component. Overplotted are the best-fit results (right side of Eq. (9)) for the three mass models, SIS (green-solid line), PLAW (dashed-blue line) and NFW (orange-shaded area, encompassing the combined 1σ uncertainty on M200 and c200).
Current usage metrics show cumulative count of Article Views (full-text article views including HTML views, PDF and ePub downloads, according to the available data) and Abstracts Views on Vision4Press platform.
Data correspond to usage on the plateform after 2015. The current usage metrics is available 48-96 hours after online publication and is updated daily on week days.
Initial download of the metrics may take a while.