Fig. 2
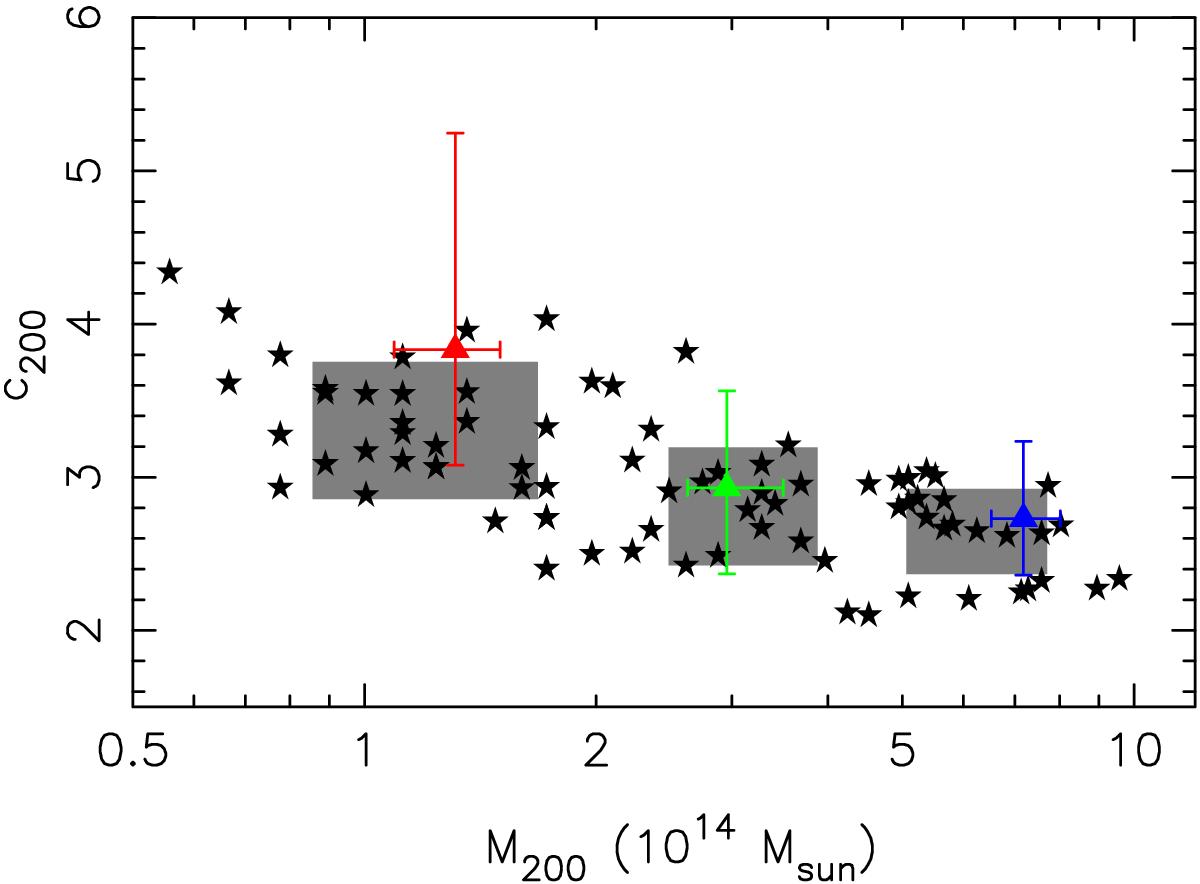
Results of the stacked analysis on simulated catalogs of lensed galaxies that mimic our observations for the full sample of 80 strong lenses. Colored triangles show the best-fit mass and concentration for the three composite lenses corresponding to stacks in richness. The gray-shaded area covers the intrinsic dispersion of the simulated lenses (black stars) around their average mass and concentration. The overlap of these average values with the results of the stacked analysis indicate the absence of any strong systematic bias.
Current usage metrics show cumulative count of Article Views (full-text article views including HTML views, PDF and ePub downloads, according to the available data) and Abstracts Views on Vision4Press platform.
Data correspond to usage on the plateform after 2015. The current usage metrics is available 48-96 hours after online publication and is updated daily on week days.
Initial download of the metrics may take a while.