Fig. 8
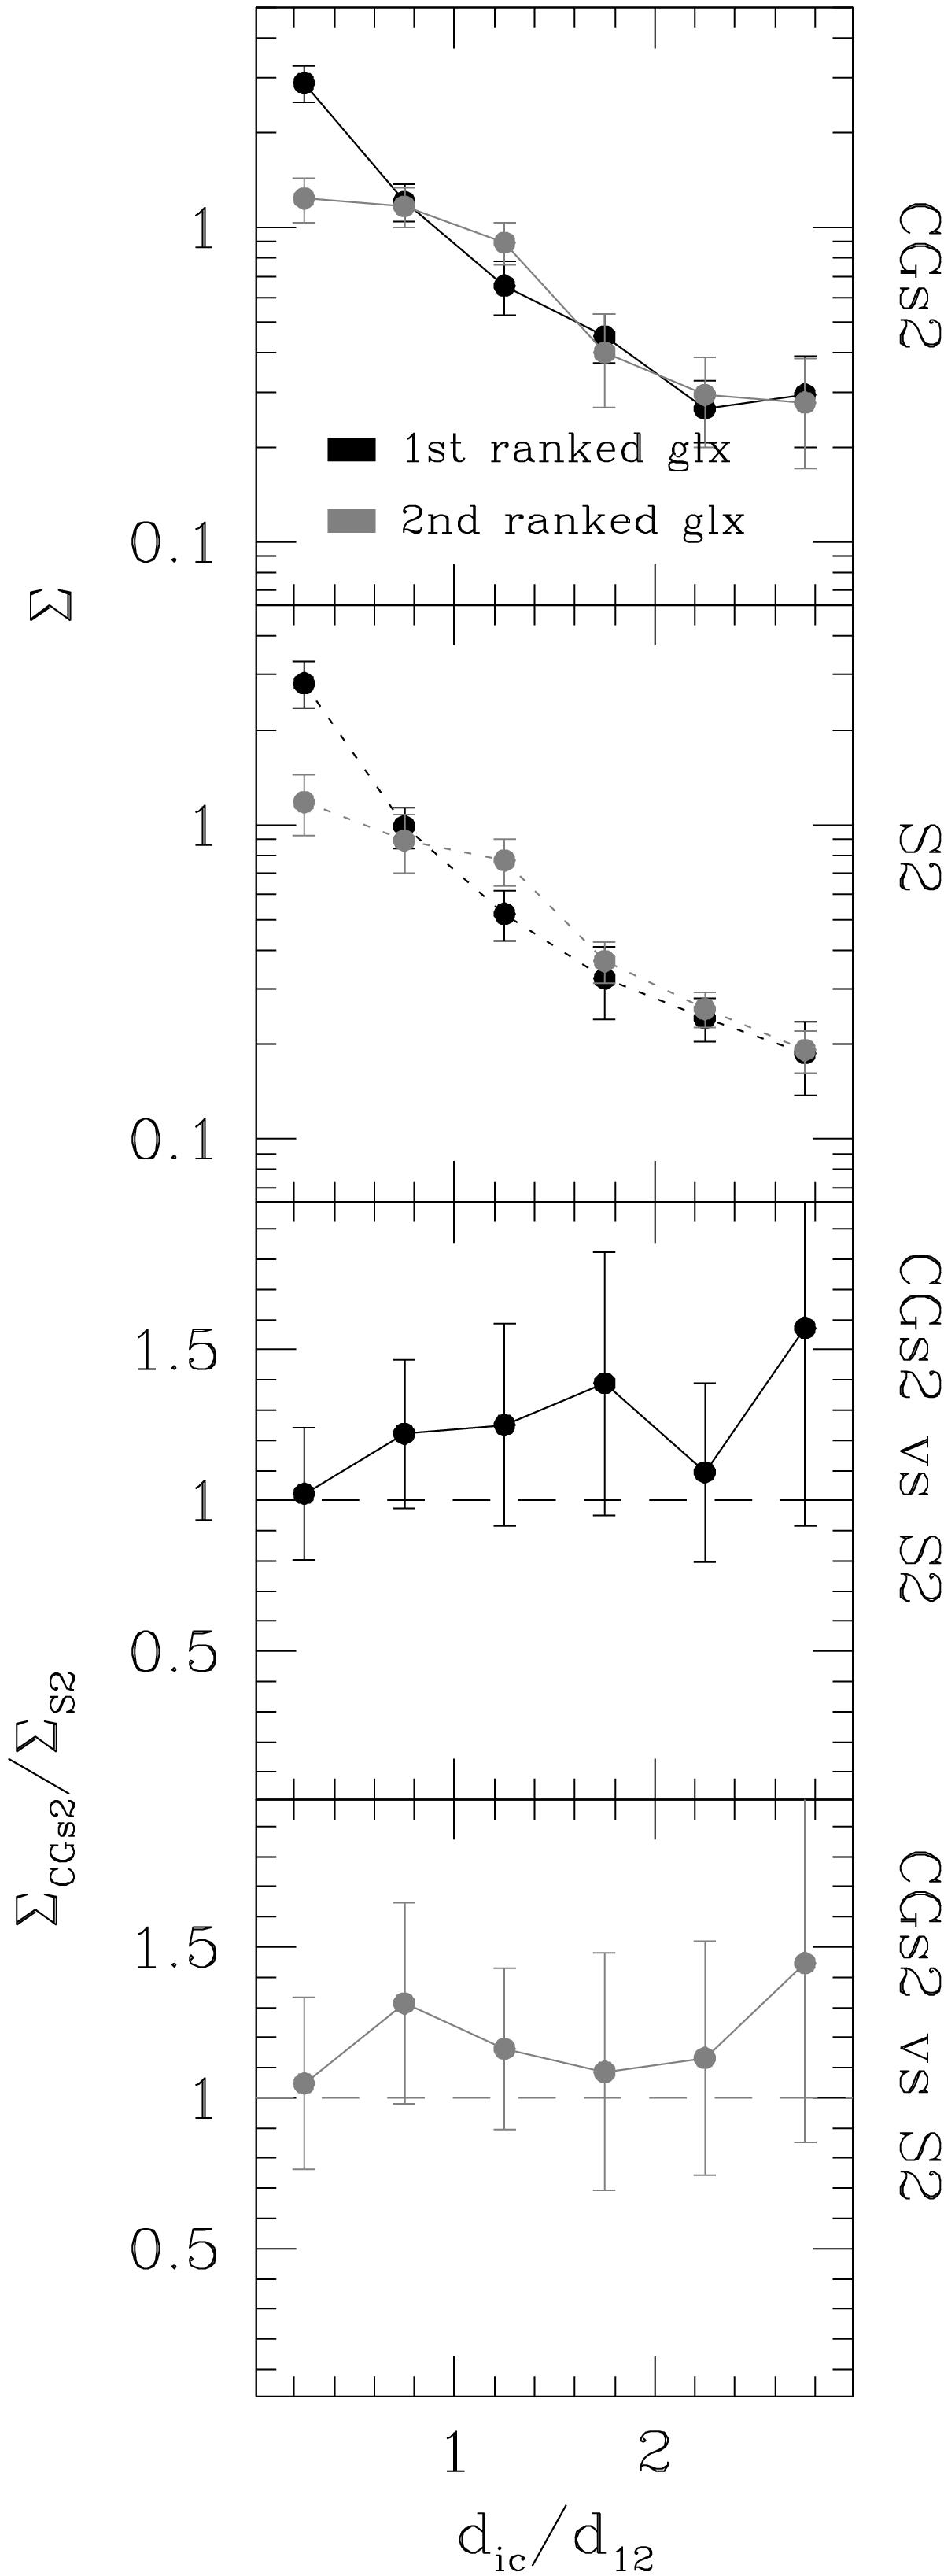
Projected number density profiles of faint galaxies around the 1st ranked (black) and 2nd ranked (grey) galaxy of the groups. Upper panel: profiles for the mock CG (CGs2) sample while the second panel shows the profiles for the control groups (S2) shown in Fig. 5. Faint galaxies are selected having rbrightest + 3 <ri< 17.77. Error bars are the standard deviations computed with 100 bootstraps. Bottom panels: ratios between the profiles around CGs2 and the profiles around S2. Errors are computed by error propagation.
Current usage metrics show cumulative count of Article Views (full-text article views including HTML views, PDF and ePub downloads, according to the available data) and Abstracts Views on Vision4Press platform.
Data correspond to usage on the plateform after 2015. The current usage metrics is available 48-96 hours after online publication and is updated daily on week days.
Initial download of the metrics may take a while.