Fig. 4
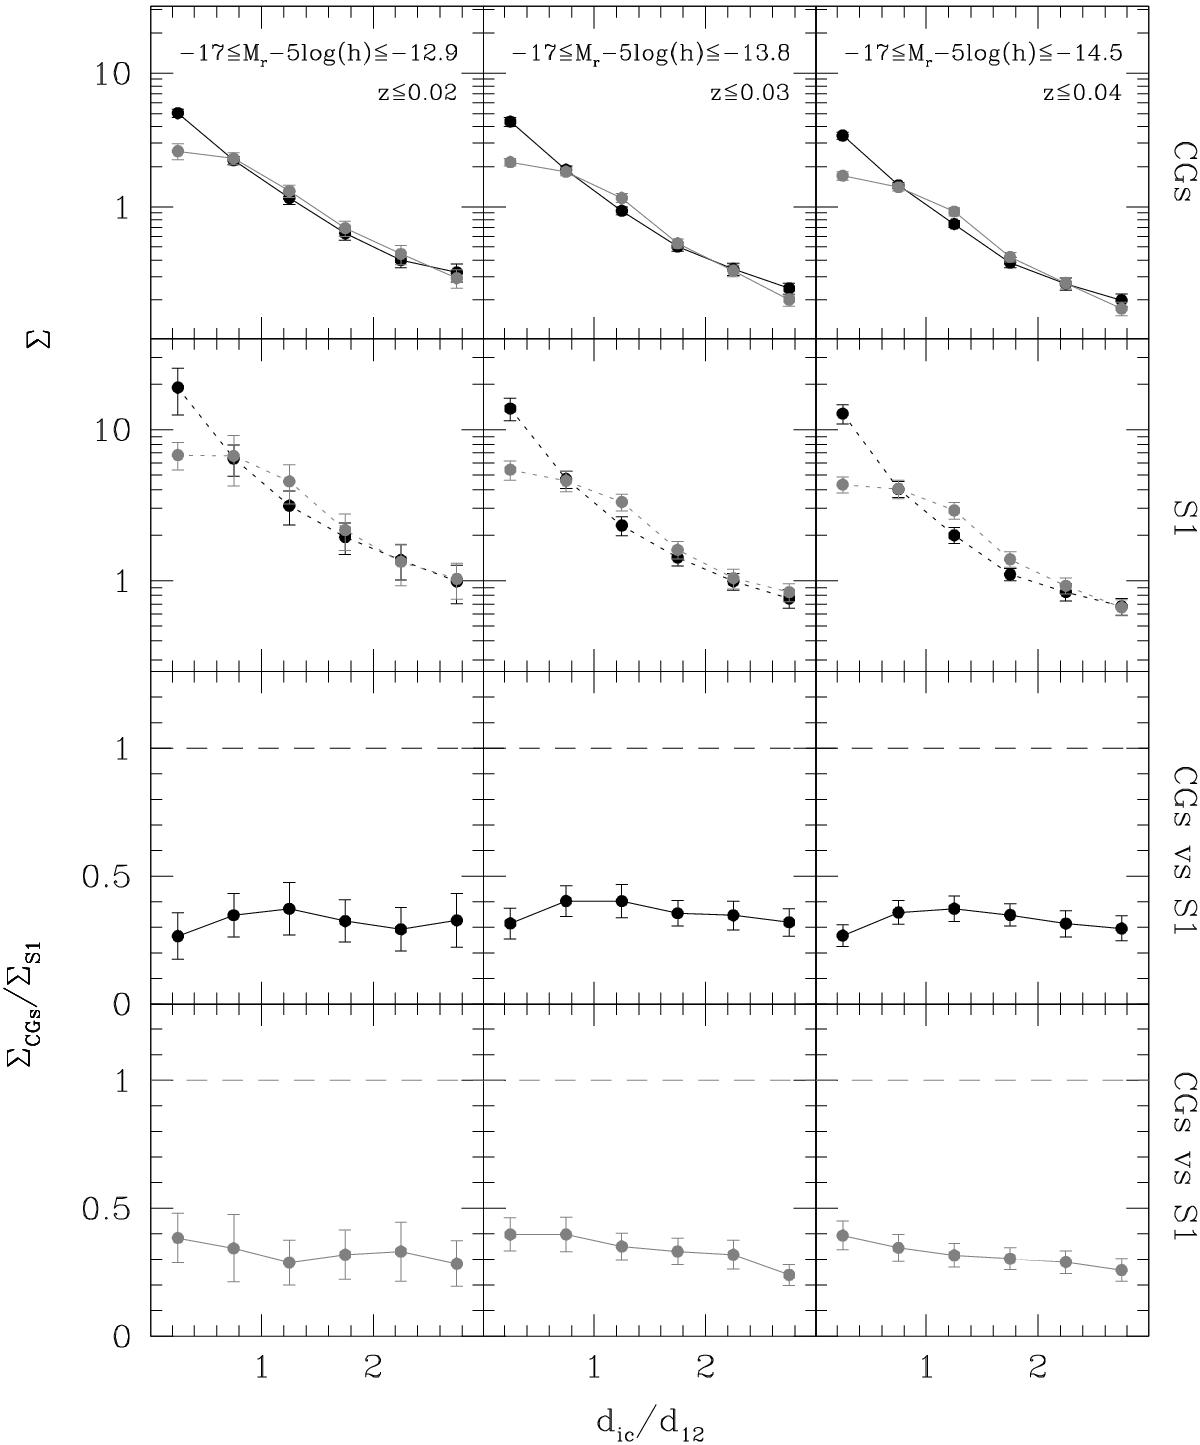
Projected number density profiles of faint galaxies around the 1st ranked (black) and 2nd ranked galaxies (grey), split into three volume-limited samples (columns from left to right). Solid lines correspond to the profiles in CGs (CGS), while dotted lines are around the control group sample (S1). Error bars are the standard deviations computed with 100 bootstraps. Bottom panels: the ratios of the profiles around CGs and S1s. Errors are computed by error propagation.
Current usage metrics show cumulative count of Article Views (full-text article views including HTML views, PDF and ePub downloads, according to the available data) and Abstracts Views on Vision4Press platform.
Data correspond to usage on the plateform after 2015. The current usage metrics is available 48-96 hours after online publication and is updated daily on week days.
Initial download of the metrics may take a while.