Fig. 3
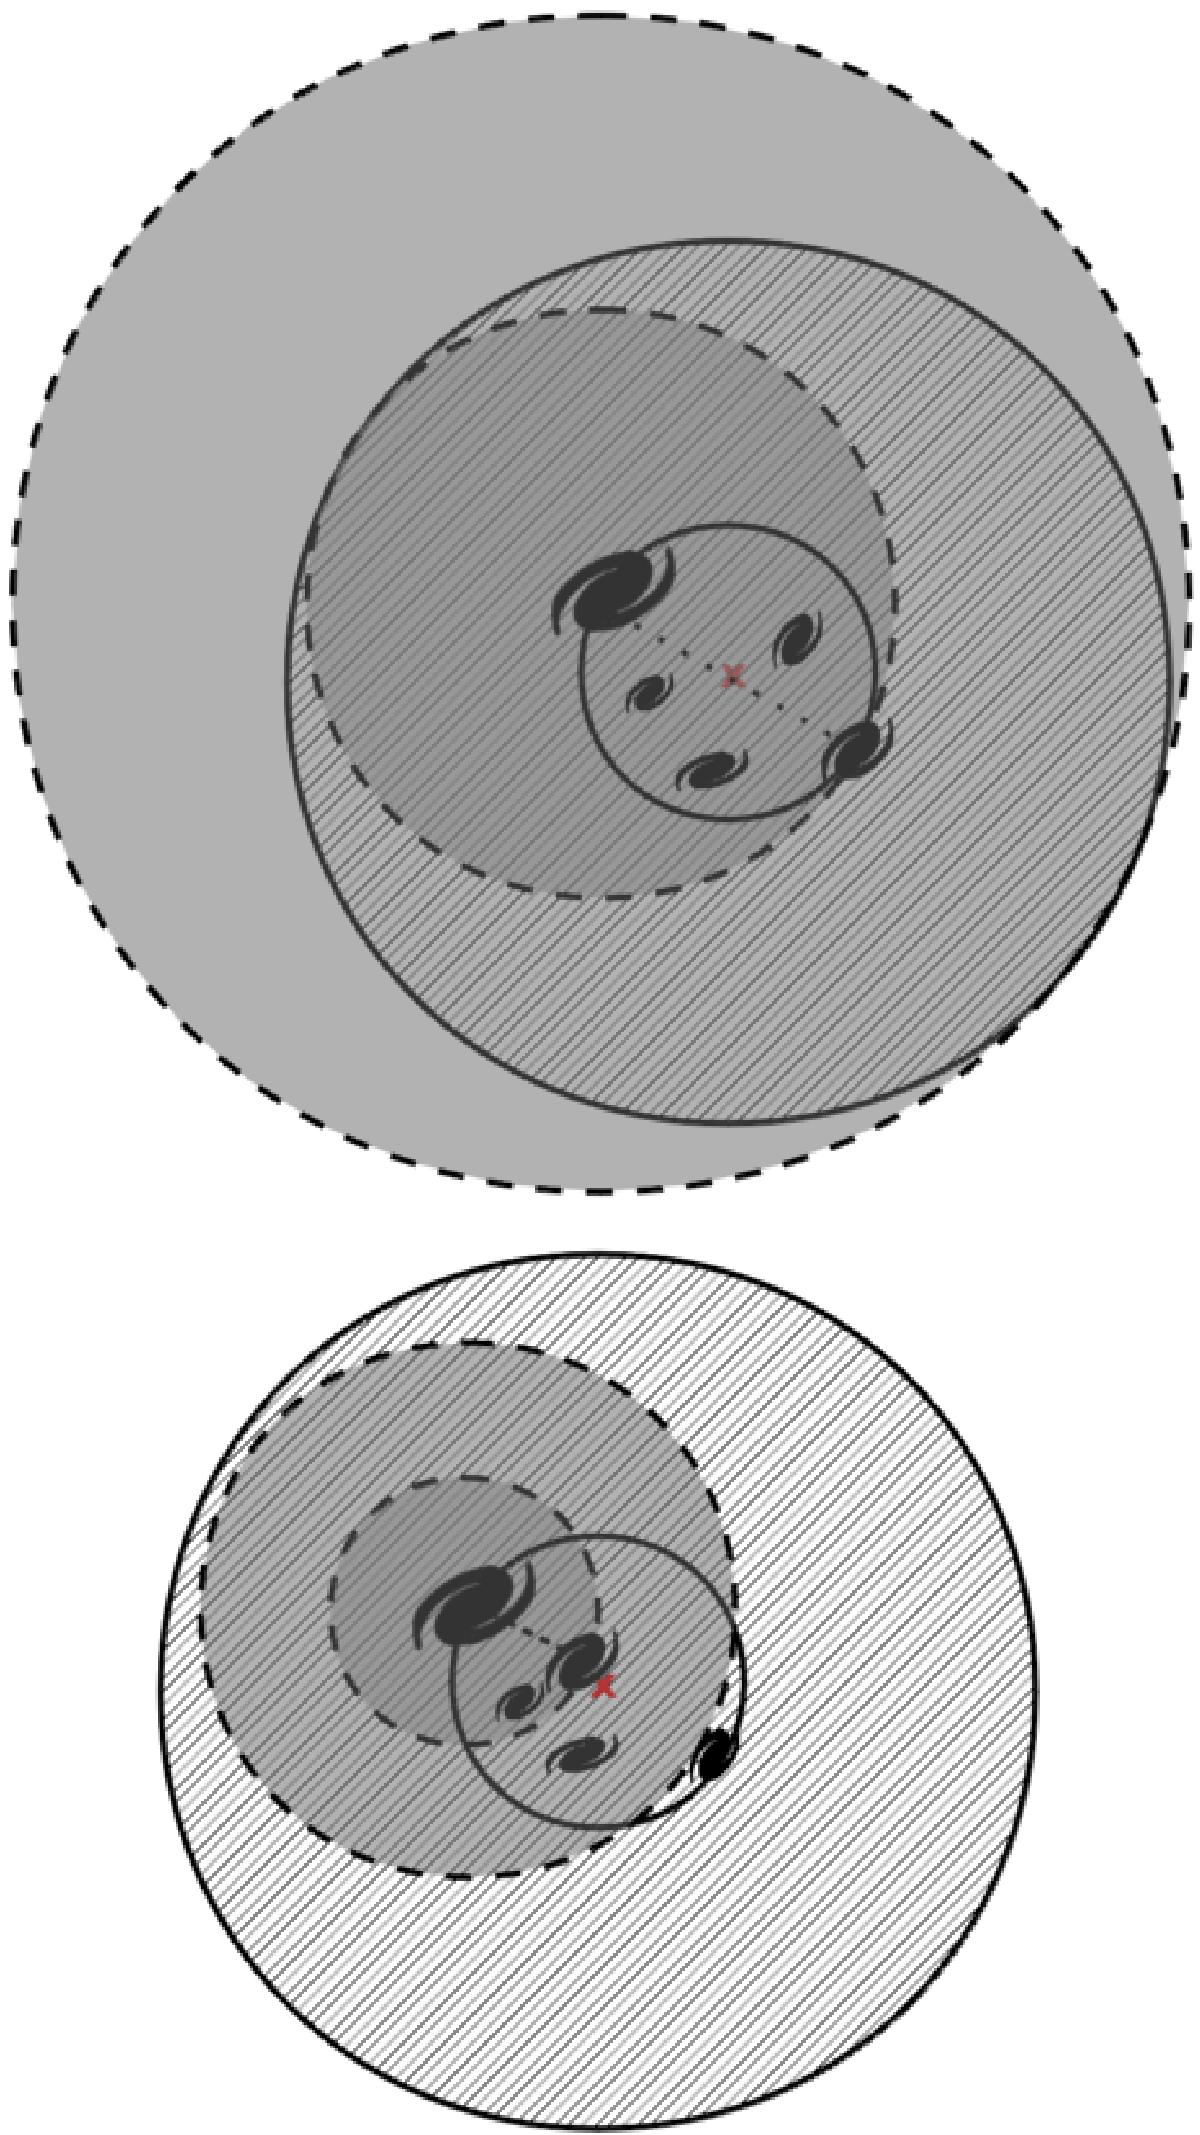
Illustrations of two CGs and the projected cylinders around the centre of the minimum circle (where faint galaxies were selected), and around the 1st (or 2nd) ranked galaxies (where the density profiles are measured). Solid lines show the minimum circle and 3 times the minimum circle. Dashed lines show the circles centred in the 1st ranked galaxies and having radii of d12 and 2 d12. Galaxies shown in this figure represent only those considered as CG members (within a 3 mag range from the brightest). Upper plot: an extreme case where the centre of the profile is on the edge of the minimum circle that encloses the CG galaxy members and the separation between the two brightest galaxies is the diameter of the minimum circle. In this extreme case, the dashed line with radius d12 is the largest circle around the 1st or 2nd ranked galaxy that falls entirely within the cylinder defined for the search of faint galaxies (solid line). Lower plot: a generic case where the centre of the profile is also on the edge of the minimum circle that encloses the CG galaxy members, but now the separation between the two brightest galaxies is smaller than the radius of the minimum circle. In this case, it is possible to go farther than 2 d12 and still be complete in the sample of faint galaxies.
Current usage metrics show cumulative count of Article Views (full-text article views including HTML views, PDF and ePub downloads, according to the available data) and Abstracts Views on Vision4Press platform.
Data correspond to usage on the plateform after 2015. The current usage metrics is available 48-96 hours after online publication and is updated daily on week days.
Initial download of the metrics may take a while.