Fig. 4
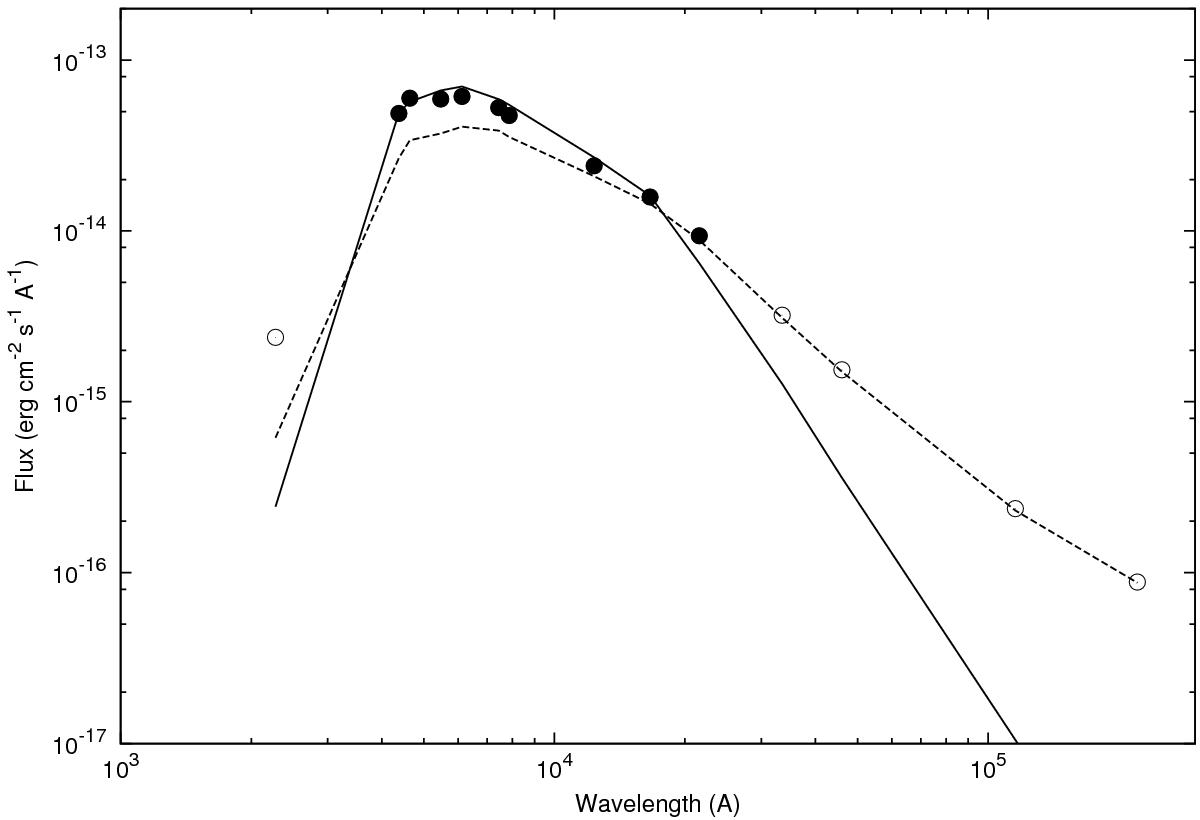
Observed and best-fitted flux densities for one example source, J05191356-0324126, for which we obtained Teff = 4900 K, AV = 0.5, which is a classical TTS according to Lee & Chen (2007). Dashed line indicates the observed photometric data. Circles are dereddened data points: solid circles are considered in the fitting process whereas open circles show ultraviolet/infrared excesses. Solid lines indicate the best-fitted BT-Settl model. Error bars for this source are smaller than point sizes.
Current usage metrics show cumulative count of Article Views (full-text article views including HTML views, PDF and ePub downloads, according to the available data) and Abstracts Views on Vision4Press platform.
Data correspond to usage on the plateform after 2015. The current usage metrics is available 48-96 hours after online publication and is updated daily on week days.
Initial download of the metrics may take a while.