Fig. 1
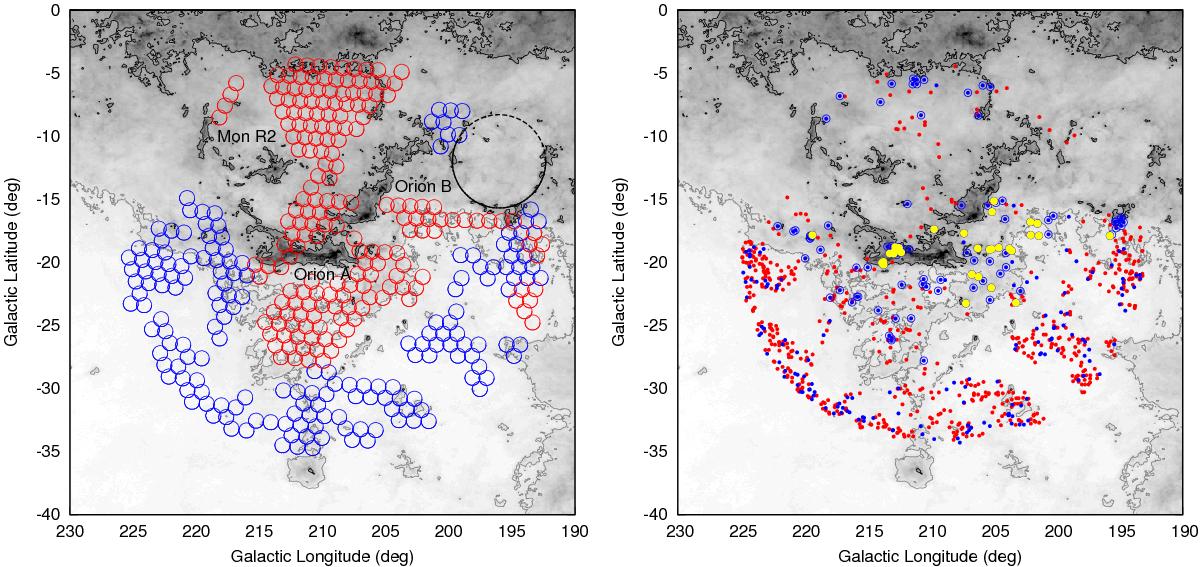
Left panel: GALEX-AIS tiles toward Orion overlaid on a map taken from the Planck Legacy Archive (HFI 545 GHz data). The map is in logarithmic gray scale from ~0.1 MJy/sr (white) to ~100 MJy/sr (black) and, for reference, it has two contours drawn at 2 MJy/sr (gray) and at 10 MJy/sr (black). Circle radii nearly correspond to the GALEX field of view (0.6 deg). Blue circles indicate pointings with data both in FUV and NUV bands, whereas red circles refer to the NUV band only. The main known star-forming regions within the studied area (Orion A, Orion B and Mon R2) are indicated as well as the λ Orionis ring (dashed circle) of clouds. Right panel: distribution of sources that satisfy Eq. (1) (inside the rectangle of Fig. 2) overlaid on the same Planck map. Blue dots are sources that do not fulfill criteria of a likely extragalactic source (any of Eqs. (2)–(4)) whereas red dots are extragalactic contaminants. Blue circles surrounding the dots represent the final selection of 111 “good” candidates (see text). There are 30 sources previously identified as YSOs by others authors (yellow circles) from which 14 were classified as classical TTSs.
Current usage metrics show cumulative count of Article Views (full-text article views including HTML views, PDF and ePub downloads, according to the available data) and Abstracts Views on Vision4Press platform.
Data correspond to usage on the plateform after 2015. The current usage metrics is available 48-96 hours after online publication and is updated daily on week days.
Initial download of the metrics may take a while.