Fig. 1
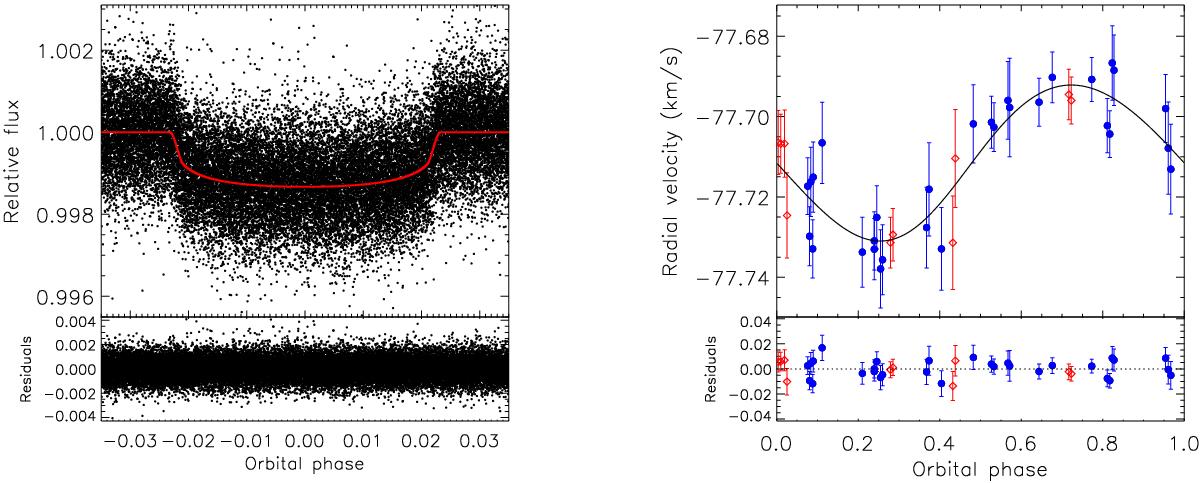
Left panel: phase-folded short-cadence transit light curve of Kepler-101b along with the transit model (red solid line). Right panel: phase-folded radial-velocity curve of Kepler-101b and, superimposed, the Keplerian orbit model (black solid line). Red and blue circles show the HARPS-N data obtained with the original and replaced CCD.
Current usage metrics show cumulative count of Article Views (full-text article views including HTML views, PDF and ePub downloads, according to the available data) and Abstracts Views on Vision4Press platform.
Data correspond to usage on the plateform after 2015. The current usage metrics is available 48-96 hours after online publication and is updated daily on week days.
Initial download of the metrics may take a while.