Fig. 4
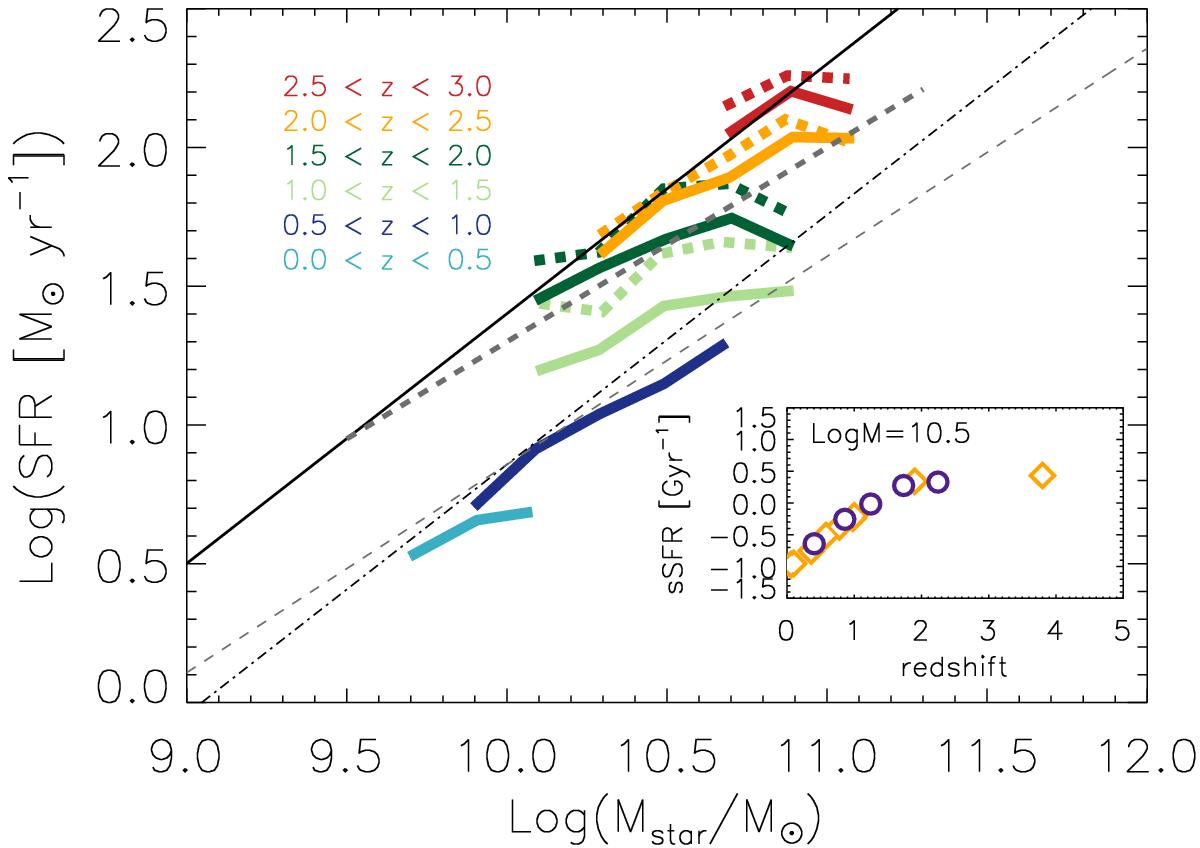
Relation between SFR = SFRUV + SFRIR and stellar mass for massive galaxies as revealed by our stacking analysis. We represent with dashed curves the points when the SFRUV is limited to values higher than 5 M⊙ yr-1. The MS of Elbaz et al. (2007; black dotted-dashed line), Daddi et al. (2007; black solid line), and Heinis et al. (2014; thick grey dashed line) are included. We also show the MS with a slope of 0.75 and the same normalization of Daddi et al. (2007) to reflect the results of Rodighiero et al. (2010) at z ≤ 1. We show in the bottom-right inset plot the evolution of the sSFR = SFR/M∗ for galaxies with log (M∗/M⊙) ~ 10.5. We also include the compilation of Dutton et al. (2010) with orange open squares.
Current usage metrics show cumulative count of Article Views (full-text article views including HTML views, PDF and ePub downloads, according to the available data) and Abstracts Views on Vision4Press platform.
Data correspond to usage on the plateform after 2015. The current usage metrics is available 48-96 hours after online publication and is updated daily on week days.
Initial download of the metrics may take a while.