Fig. 2
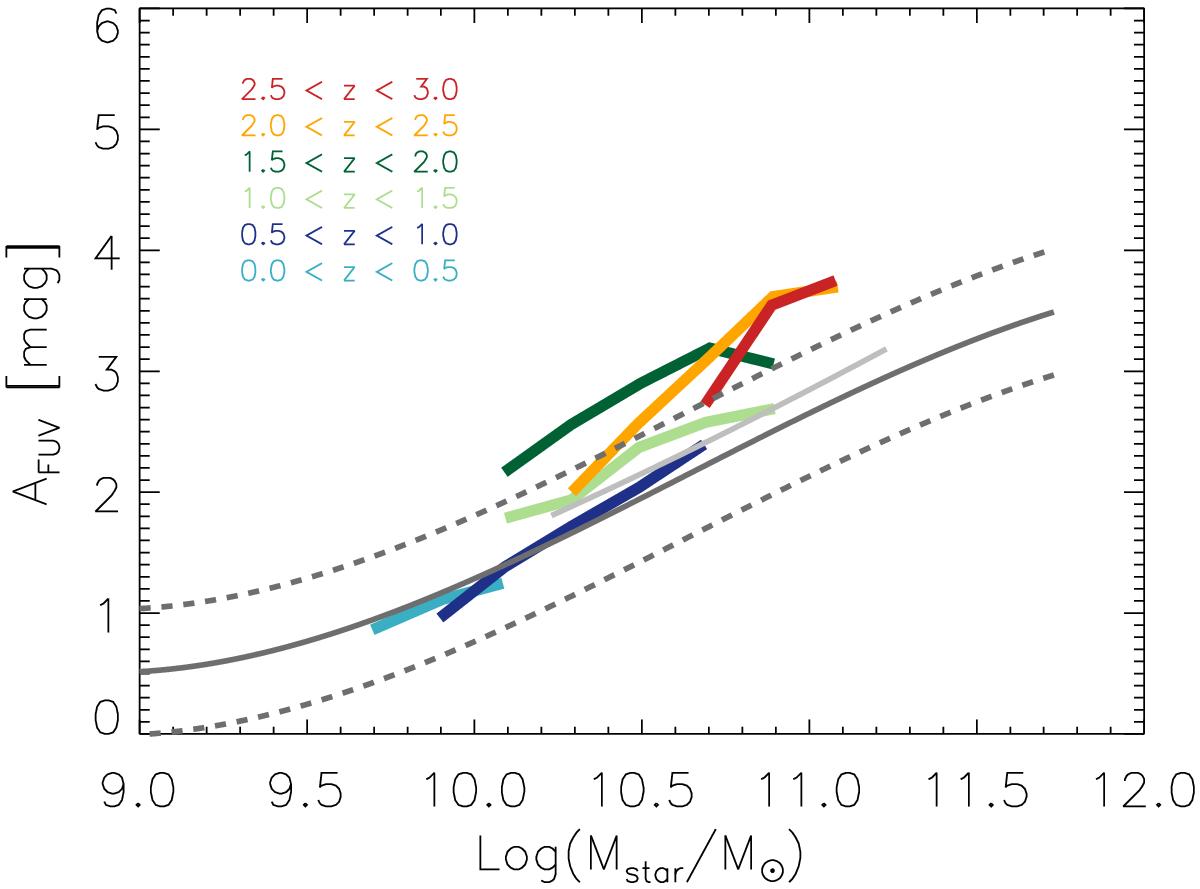
Relation between dust attenuation and stellar mass for our stacked galaxies over 0.02 ≲ z ≲ 3.0, with the color code shown in the top-left corner. The dust attenuation was derived with the LIR/LUV ratio and the calibration of Buat et al. (2005). For reference, we represent the local relation as reported in Sobral et al. (2012) with a solid dark gray curve and the relation at z ~ 1.5 presented in Heinis et al. (2014) with a light gray solid line.
Current usage metrics show cumulative count of Article Views (full-text article views including HTML views, PDF and ePub downloads, according to the available data) and Abstracts Views on Vision4Press platform.
Data correspond to usage on the plateform after 2015. The current usage metrics is available 48-96 hours after online publication and is updated daily on week days.
Initial download of the metrics may take a while.