Fig. 1
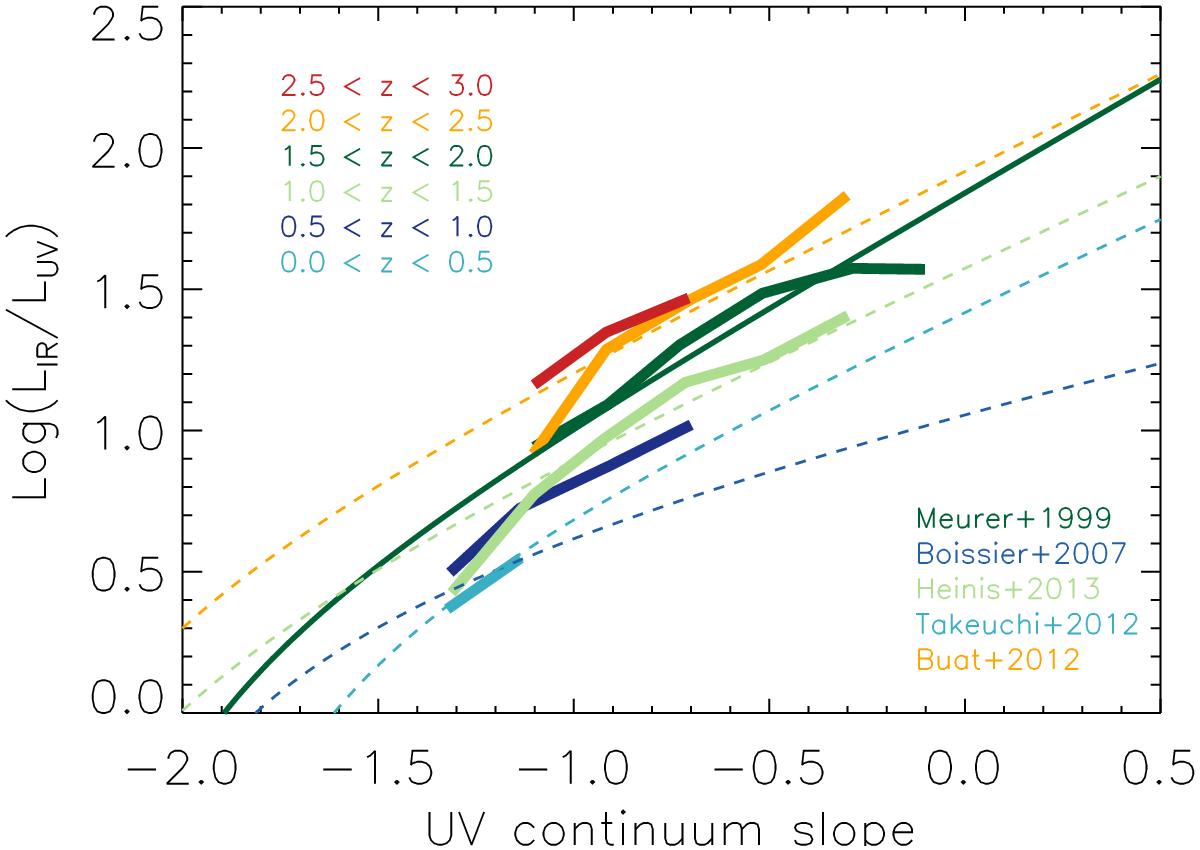
Relation between the total IR and rest-frame UV luminosities (a proxy for dust attenuation) against the UV continuum slope as seen by our stacking analysis over 0.02 ≲ z ≲ 3.0, with the color code shown in the top-left corner. We also represent the IRX-β relations reported in previous works (Meurer et al. 1999; Boissier et al. 2007; Heinis et al. 2013; Takeuchi et al. 2012; Buat et al. 2012), as indicated in the bottom-right corner. Their color code is related to the data they fit best.
Current usage metrics show cumulative count of Article Views (full-text article views including HTML views, PDF and ePub downloads, according to the available data) and Abstracts Views on Vision4Press platform.
Data correspond to usage on the plateform after 2015. The current usage metrics is available 48-96 hours after online publication and is updated daily on week days.
Initial download of the metrics may take a while.