Fig. B.1
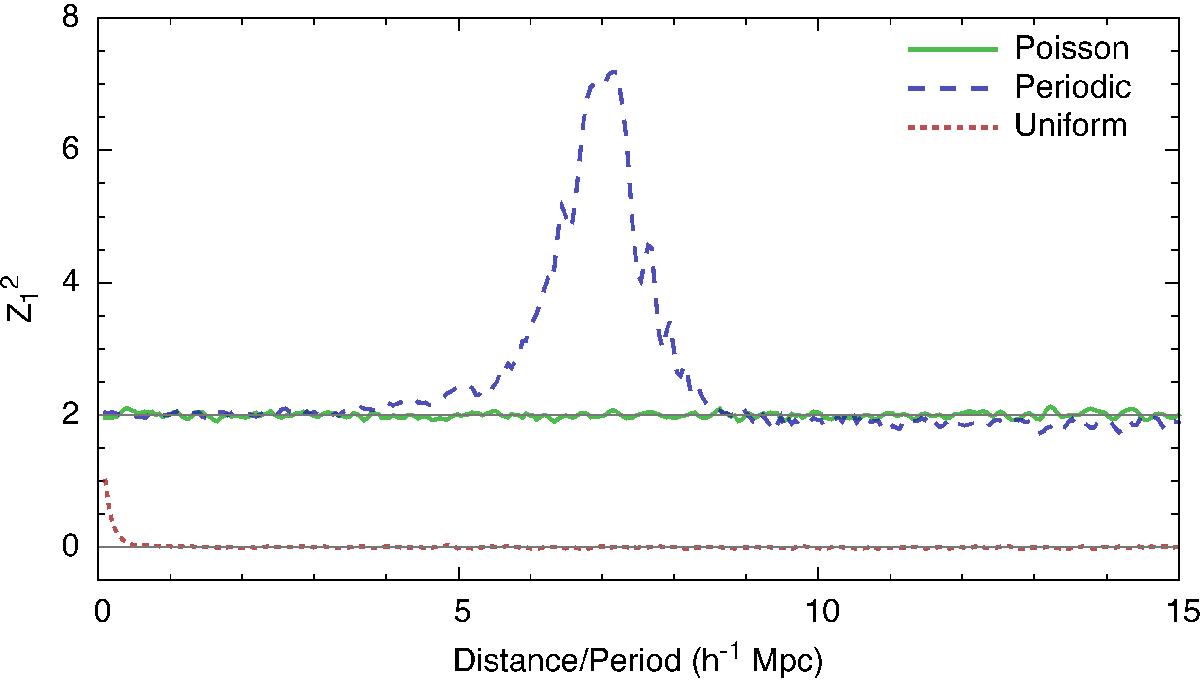
Z-squared statistics for three cases. The green line shows the Z-squared statistic for a Poisson sample. The blue line shows the statistic for a periodic signal, where the period for each datapoint is drawn from a Gaussian distribution centred at 7 h-1 Mpc with a standard deviation of 0.5 h-1 Mpc. The red line shows the statistic for data points with an uniform point distribution – see text for more information.
Current usage metrics show cumulative count of Article Views (full-text article views including HTML views, PDF and ePub downloads, according to the available data) and Abstracts Views on Vision4Press platform.
Data correspond to usage on the plateform after 2015. The current usage metrics is available 48-96 hours after online publication and is updated daily on week days.
Initial download of the metrics may take a while.