Fig. A.1
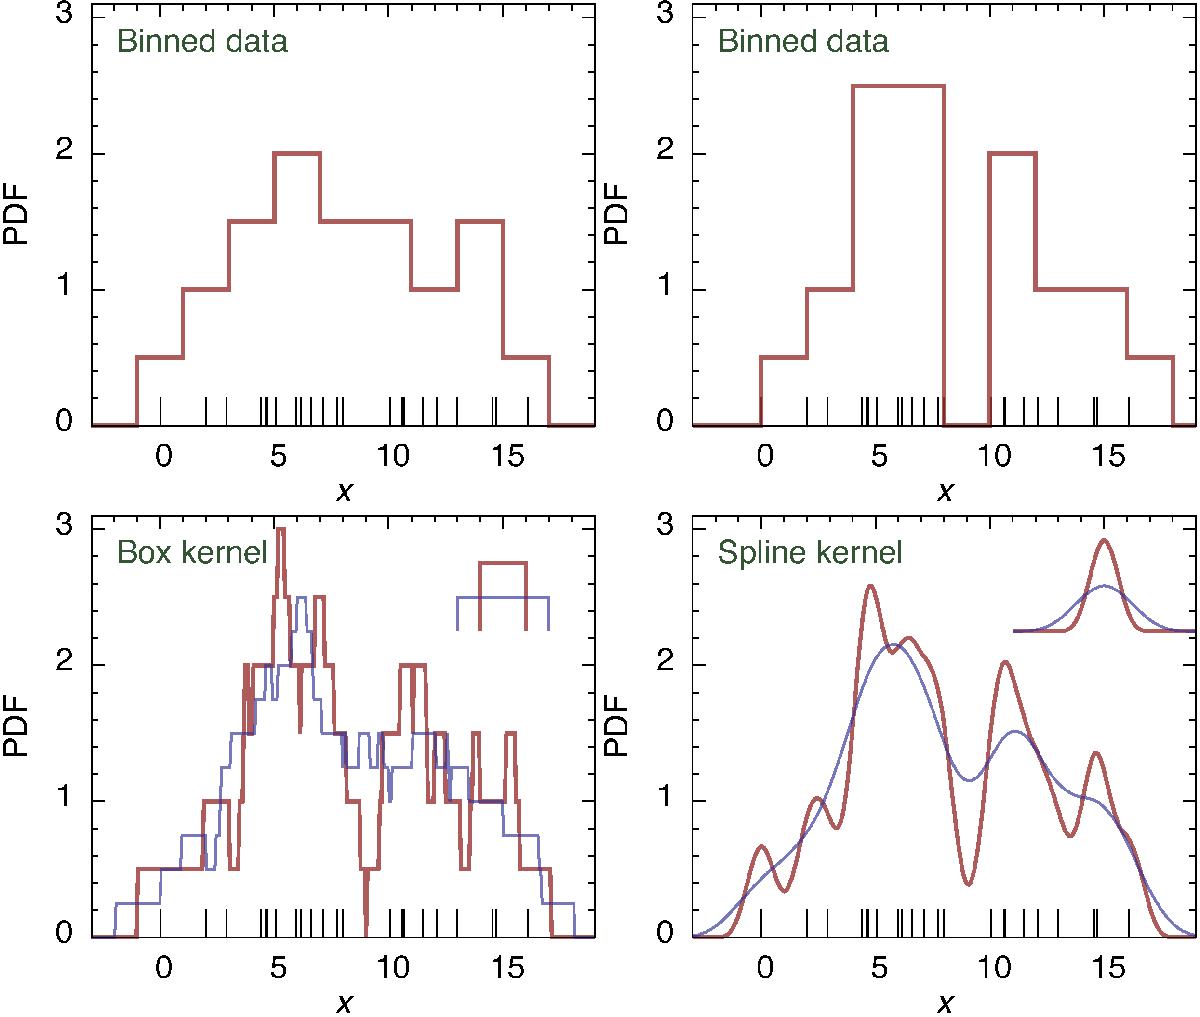
Upper row: probability density estimation using binning. In the left and right panels, the bin width is the same but the centre of the bin is shifted. Bottom row: density estimation using kernel smoothing. In the bottom left panel the simplest box kernel is used, in the bottom right panel the B3 spline kernel is used. The kernel shape and size is shown in the upper-right corner of the figures. The rug plot on the bottom axis shows the data points that were used for density estimation.
Current usage metrics show cumulative count of Article Views (full-text article views including HTML views, PDF and ePub downloads, according to the available data) and Abstracts Views on Vision4Press platform.
Data correspond to usage on the plateform after 2015. The current usage metrics is available 48-96 hours after online publication and is updated daily on week days.
Initial download of the metrics may take a while.