Fig. 5
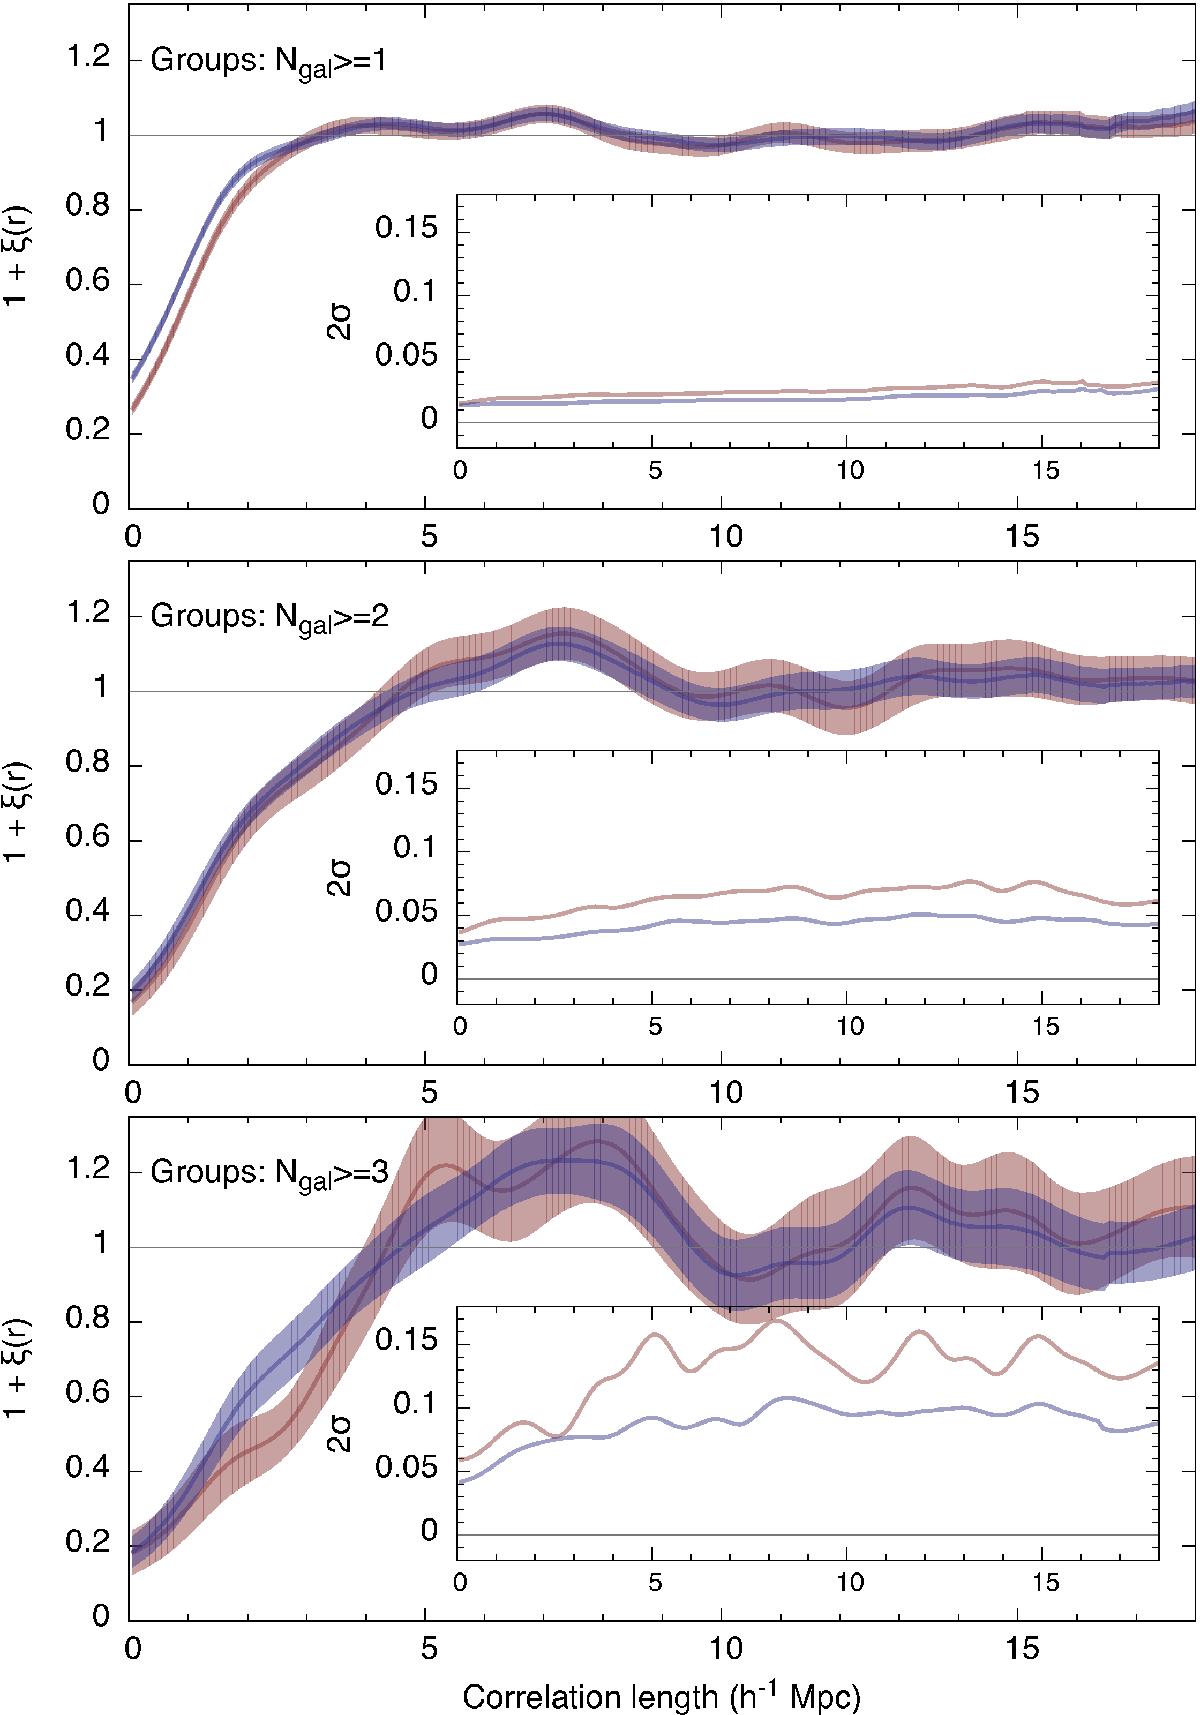
Correlation function along filaments for groups. The upper panel shows the correlation function for all groups and isolated galaxies together, the middle panel shows the correlation function only for groups with two or more members, and the bottom panel for groups with at least three member galaxies. The group richness (number of galaxies in a group) is taken from Tempel et al. (2014c). Blue lines show the correlation function for groups closer than 0.5 h-1 Mpc to the filament axis and red lines show the correlation function for groups closer than 0.25 h-1 Mpc. The shaded regions are the 95% confidence intervals. The insets show the width of the 95% confidence regions as a function of the pairwise distance.
Current usage metrics show cumulative count of Article Views (full-text article views including HTML views, PDF and ePub downloads, according to the available data) and Abstracts Views on Vision4Press platform.
Data correspond to usage on the plateform after 2015. The current usage metrics is available 48-96 hours after online publication and is updated daily on week days.
Initial download of the metrics may take a while.