Free Access
Fig. 5
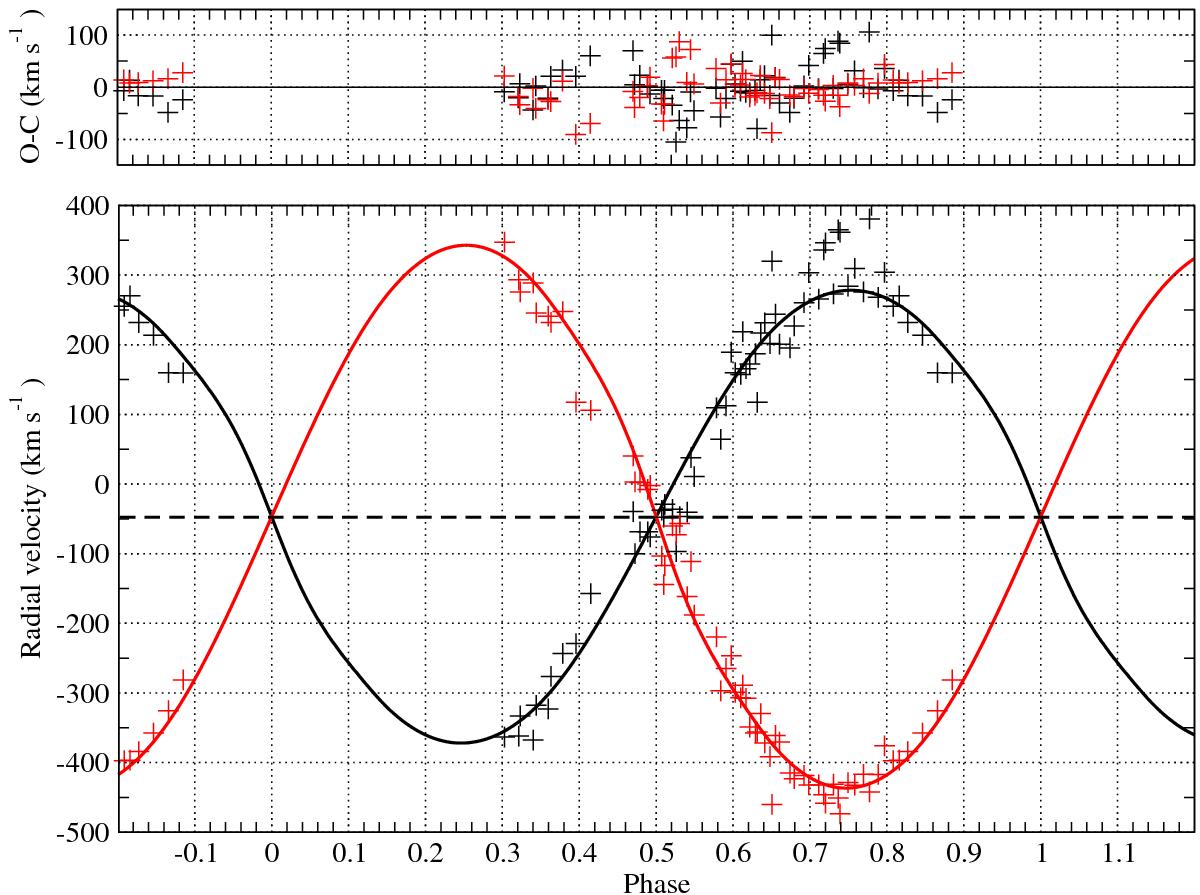
Radial velocity curves fitted to the observational data and displayed against orbital phase (black line: primary star; red line: secondary star) fitted to the observational data. The dashed line corresponds to the systemic velocity. The residuals are displayed in the top panel.
Current usage metrics show cumulative count of Article Views (full-text article views including HTML views, PDF and ePub downloads, according to the available data) and Abstracts Views on Vision4Press platform.
Data correspond to usage on the plateform after 2015. The current usage metrics is available 48-96 hours after online publication and is updated daily on week days.
Initial download of the metrics may take a while.